Dildan Kavak1, Ömer Satici2 and Vatan Kavak3*
1Department of Molecular Biology and Genetics, Faculty of Medicine, Dicle University, Turkey
2Department of Education, Faculty of Medicine Biostatistics, Dicle University, Turkey
3Department of Anatomy, Faculty of Medicine, Dicle University, Turkey
*Corresponding Author: Vatan Kavak, Department of Anatomy, Faculty of Medicine, Dicle University, Turkey.
Received: February 16, 2021; Published: March 29, 2021
Our Goal: To investigate the development of male baby rats born from mother rats fed with different diet groups starting from embryonal period to adulthood.
Objective: To determine the percentage of morphologically abnormal spermatozoa in the caudal epididymis, the slides stained with eosin-nigrosin were prepared.
Methodology: Low protein diet (LPD) 4%; Control protein diet (CPD) 24%, Middle protein diet (MPD) 12% and yogurt diet groups fed with different diets were followed by the same method in rats. The female rats whose uterine arteries were ligated on day 17 of gestation bilaterally intrauterine growth restriction began to be fed with Control protein diet (CPD9 24%.
The epididymis was finely minced with anatomical scissors in 10 ml of physiologic saline, placed in a rocker for 10 minutes, and allowed to sit at room temperature for two minutes.
The fluid obtained from the caudal epididymis with a pipette was diluted to 2 ml with Tris buffer solution.
Right testes from the rats were placed in 10% Bouin solution for 24 hours for fixation and further pathologic examination.
Statistics: Mann Whitney U test and Kruskal Wallis tests were used.
Results: The average weight of the experimental groups was different in testis location. Epididymis and vesicula seminalis locations; the mean weight of the experimental groups was different.
Conclusion: The spermium development in the locations is examined; the development of testis, epididymis, vesicula seminalis, prostate and motility were found to be different according to the groups. Density did not differ between groups.
Keywords: Protein Malnutrition; Testes Morphology; Diet
Nutrition plays a crucial role in the maturation and functional development of the central nervous system (CNS). However, malnutrition during pregnancy is still a serious health problem in underdeveloped and developing countries. The feeding of the mother rat has an impact on the development and health of offspring during pregnancy starting from fertilization. The feeding of the mother rat affects almost all body systems of infant rats and this effect is quite high on reproductive performance. Protein restriction has a greater effect on the central nervous system. In the studies conducted by Tatlı., et al. It is reported that the brain volumes of baby rats fed with a low protein diet did not develop [2].
The present study confirmed that unwanted estrogen effects to be higher in the parenteral administered group on examination of sexual behavior and histological damage of epithelium in the testes and epididymis of male rats Investigators confirmed that undesired estrogen effects were higher in the parenterally administered group in the examination of sexual behavior and histological damage to the epithelium in the testes and epididymis of baby male rats during the embryonic period [1,3]. Intra-and post-uterinal circle period in the growth and development during pregnancy and lactation nutritional provided by the mother was under the influence of hormonal and metabolic factors [4,5]. In recent years, studies of the physiology of the body or nutritional deficiencies seen in the fetal period of discomfort or morphology revealed that critical period cause long-term or permanent changes. Here it is; one of the mechanisms of adaptation to inadequate dietary source off ast-growing organism is slowing the rate of cell division in tissues and organs. In this case, the programming of the system structure and function in adulthood can lead to changes in the organism.
Exposure to energy and protein restriction is effective on specific physiological control systems of adult life. For example, a general limitation of early nutrition in humans during pregnancy, which increases the risk of coronary heart disease, affects cardiovascular system. Late in the restriction formed during pregnancy [1].
The data presented in our study clearly show both prenatal and early postnatal periods are critical periods for the regulation of postnatal growth. There was there increased chance of being affected by epigenetic factors such as dietary protein and intrauterine growth restriction and Control protein diet (IUGR and CPD). Lowest growth was observed especially Low protein diet (LPD) rats and highest growth was seen in control rats. Kavak., et al. They express in their research: both late prenatal and early postpartum critical periods for periods regulation of postpartum growth. Was here increased chance of being affected by epigenetics factors such as dietary protein and IUGR and CPD. The lowest growth was observed especially in LPD rats and the highest growth was seen in control rats [7]. In our previous studies inversely proportional to the amount of protein from this degeneration is reported [3]. Different investigators, in their study reported that high protein diets in bull semen characteristics of the positive impact on [4,5].
Until now, different degrees in nutrition with protein mammals, although it has investigated the effects on reproduction [3,6-8], explores the impact of semen characteristics of protein levels play an important role in spermatogenesis in scans made of the number of studies was found to be inadequate.
In the present study, rats fed with different protein content testicular morphology and investigated the effects on semen characteristics.
At the beginning of the investigation, thirty fifty female rats were divided into 5 cages. Each cage consisting of 10 female rats and 5 male rats with them was put into 5 different cages randomly with respect that they should have the same weight. During mating all of the rats were fed with isocaloric 24% control protein diet (CPD). The female rat’s in gestation were determined and separated from the male rats and put into five different cages. Fifty pregnant Wistar rats and their 250 newborn male rats were included in this study.
In the first group, the female rats began to be fed with isocaloric Low protein diet (LPD) 4%. During the neonatal period, in this study group, the newborn pups were housed by their mothers. The newborn male rats (n = 50) were weaned on postnatal day 22 by separating them from their mothers and placed in hanging basket cages. After the mother rat rods over their offspring after weaning, pups in the group of rats of different female and male cages were followed until adulthood. These newborn rats were fed with Low protein diet (LPD) 4% from weaning till adolescence.
In the second group, female rats were fed a 12% isocaloric Medium protein diet (MPD). Newborn baby rats in this study group were housed by their mothers. Newborn male rats (n = 50) were separated from their mothers on the postnatal 22nd day and placed in drooping basket cages. Newborn rats belonging to this group were followed up from weaning to adulthood by feeding with 12% Medium protein diet (MPD).
In the third group, Female rats in the third group were fed with a 24% isocaloric Control protein diet (CPD). Newborn baby rats born from mother rats in this study group were followed in their mothers' cages. Newborn male rats (n = 50) were separated from their mothers on the postnatal 22nd day and placed in different hanging cages. Newborn infant rats included in this study were fed a 24% Control protein diet (CPD) from weaning to adulthood.
In the fourth group, Female rats in the fourth group were fed with a yogurt diet. In this study group, newborn babies were followed in their mothers' cages. Newborn male rats (n = 50) were separated from mother rats on the 22nd day after birth and placed in drooping basket cages. Newborn male rats in this group were followed from weaning to adulthood by feeding only yogurt.
In the fifth group, Female rats whose uterine arteries were ligated on the 17th day of bilateral gestation in the fifth group (n = 10). Intrauterine growth restriction (IUGR) was fed with a 24% Control protein diet (CPD). Newborn baby rats in this study group were followed in cages together with their mothers. Newborn male rats (n = 50) were separated from their mothers on the 22nd day after weaning and placed in drooping basket cages. Newborn rats in this group were fed with a 24% Control protein diet (CPD) from weaning to adulthood.
Intra uterine growth restriction (IUGR) was induced by bilateral uterine artery ligation on day 17 of gestation according to a modified method of Wigglesworth [10].
Rats were obtained from the Research and Applied Health Center of Dicle University. The experiment was performed in accordance with guidelines for animal research from the National Institutes of Health and were approved by the Dicle University Ethics Committee on Animal Research (Approval no: October 04, 2012).
DietsThe three diets were isocaloric, consisting of a 24% control protein diet, an experimental middle-protein diet (MPD) of 12% protein, and an experimental low-protein diet of 4% protein. The three diets were based on the AIN-93G standard diet recommended to support growth [11]. The three diets (Dyets, Bethlehem, PA) were isocaloric; thus, the only dietary variable altered was protein (Table 1). Food consumption and spillage were measured to the nearest 0.1 gusing a Tefal Scientific Model Gourmet 7986502/261-0304 electronic scale.
|
Ingredient (g/kg) |
Low (4% protein) diet |
Middle (12% protein) diet |
Control (24% protein) diet |
|
Casein |
46.00 |
141.00 |
276.00 |
|
Cornstarch |
500.90 |
432.86 |
329.90 |
|
Dyetrose |
167.00 |
144.20 |
110.00 |
|
Sucrose |
100.00 |
100.00 |
100.00 |
|
Cellulose |
50.00 |
50.00 |
50.00 |
|
Soybean oil |
70.00 |
70.00 |
70.00 |
|
t-Butylhydroquinone |
0.014 |
0.014 |
0.014 |
|
Salt mix#213266 |
35.00 |
35.00 |
35.00 |
|
Calcium phosphate dibasic |
11.66 |
8.63 |
4.08 |
|
Calcium carbonate |
3.91 |
6.14 |
9.49 |
|
Vitamin mix#310025 |
10.00 |
10.00 |
10.00 |
|
L-Cystine |
0.700 |
0.75 |
4.10 |
Table 1: Different protein diet feeds used in the study.
Other diet was only yogurt (Table 2).
|
Composition |
Amount |
|
Water |
80-86% |
|
Dry Matter |
14-20% |
|
Fat |
2-8% |
|
Protein |
4-8% |
|
Milk sugar |
2-5% |
|
Mineral Substance |
0.8-1.2% |
|
Acidity |
0.9 |
Table 2: The composition of yogurt used in the study.
|
Groups |
Testis |
Epididymis |
Vesicula seminalis |
Prostate |
Density |
Motility (%) |
N |
|
Control |
14416,50 ± 1208,52A |
0,71 ± 0,98 A |
0,66 ± 0,73A |
0,72 ± 0,11A |
25.66 ± 5.24 |
0,65 ± 0,11A |
36 |
|
Ligature |
1398,71 ± 65,02 |
0,54 ± 0,03 |
0,14 ± 0.62 |
0,81 ± 0,11 |
26.00 ± 6.16 |
0,66 ± 0,07 |
46 |
|
%4 diet |
548,10 ± 687,78 |
0,28 ± 0,14 |
0,38 ± 0.67 |
0,32 ± 0,20 |
14.85 ± 8.97 |
0,13 ± 0.17 |
42 |
|
%12 diet |
763,95 ± 65,79 |
0,40 ± 0,09 |
0,33 ± 0.57 |
0,43 ± 0,22 |
23.16 ± 6.33 |
0,62 ± 0,13 |
44 |
|
Yogurt |
1074,33 ± 53B |
0,31 ± 0,01B |
0,65 ± 0.14B |
0,40 ± 0.08B |
20.33 ± 9.01 |
0,33 ± 0.15B |
18 |
|
P |
KW = 20,35 P = 0,000 |
KW = 24,49 P = 0,000 |
KW = 14,85 P = 0,005 |
KW = 18,69 P = 0,001 |
KW = 8,21 P>0,05 NS |
KW = 24,29 P = 0,000 |
|
|
N |
31 |
32 |
31 |
31 |
30 |
31 |
155 |
Table 3: Sperm characteristics of controls and locations in other groups. Values with different superscripts in the same column are significantly different (A: P < 0.05B: P < 0.05).
When we examine the findings according to table 3; the findings are as follows.
The study consists of five different groups. Baby male rats born from mother rats fed normal food during the embryonal period were followed from weaning to adulthood. When the sperm characteristics of 36 male baby rats included in the study of the normal group were examined, the findings were to be revealed as on the table 3. On the table 3, the average sperm motility, average sperm density, average testicular area, average epididymis remains to be as the mean values of the vesicle seminalis and the prostate area were found.
Baby male rats born from mother rats fed with 12% protein in the embryonal period; it was followed from weaning to adulthood. When the sperm characteristics of 44 male rats in the 12% protein feed group were examined; the findings are shown in table 3. Average sperm motility, average sperm density, average testicular area, average epididymis, mean vesicle seminalis and average prostate values are the values found in table 3.
Baby male rats born from mother rats fed yoghurt in the embryonal period were followed until adulthood without weaning. When the sperm characteristics of 18 male juvenile rats in the yogurt feed group were examined; the findings are shown in table 3. Average sperm motility, average sperm density, average testicular area, epididymis average, Vesicula seminalis average and average prostate values were found.
Male baby rats born from mother rats, whose uterine artery was attached during the embryonal period and fed with control protein feed; it was followed from weaning to adulthood. The uterine artery was ligated and born from mother rats fed a control protein diet; when the sperm characteristics of 50 male baby rats were examined; Findings are as shown in table 3. In table 3; Average sperm motility, Average sperm density, Average testicular area, Average epididymis, Average vesicle seminality, Average prostate score were found.
Baby male rats born from mother rats fed control protein during embryonal period were followed from weaning to adulthood. Sperm characteristics of 50 male baby rats belonging to the group fed the control protein diet; the findings are shown in table 3.
Genital organs weight table 4.
|
Groups |
Left Testis (g) |
Left Epididymis (g) |
Vesicula Seminalis (g) |
Prostate (g) |
|
Control |
1.44 ± 0.05b |
0.71 ± 0.04c |
1.12 ± 0.10ab |
0.73 ± 0.05b |
|
Ligature |
1.41 ± 0.02b |
0.55 ± 0.01b |
1.53 ± 0.13b |
0.85 ± 0.05b |
|
%4 |
0.93 ± 0.14a |
0.28 ± 0.05a |
0.58 ± 0.22a |
0.33 ± 0.08a |
|
%12 |
1.03 ± 0.08a |
0.38 ± 0.03a |
0.80 ± 0.12a |
0.39 ± 0.08a |
|
Yoğurt |
1.19 ± 0.03ab |
0.32 ± 0.01a |
0.66 ± 0.08a |
0.41 ± 0.05a |
Table 4: Weights of reproductive organs including prostate, vesicula seminalis, left epididymis and left testicle.
abc: Values with different superscripts in the same column are significantly different (P < 0.01).
When we examine the findings according to table 4; Findings are as follows.
Baby male rats born from mother rats fed with 4% protein in the embryonal period were observed from weaning to adulthood. Organ weights in the reproductive canal; Average left testis weight, left epididymis average weight, left vesicle seminalis average weight, average prostate weight, testicular region average, vesicle seminalis average and average prostate values are shown in table 4.
Male baby rats born from mother rats fed with 12% protein in the embryonal period were followed from weaning to adulthood. Organ weights in the reproductive canal; Mean left testis weight, mean left epididymis weight, mean weight of left vesicula seminalis and mean prostate weight are shown in table 4.
Male baby rats born from mother rats fed with yoghurt-protein feed in the embryonal period; they were followed up from weaning to adulthood. The values belonging to this group are shown in table 4.
In the embryonal period; Baby male rats born from mother rats fed control protein feed were followed from weaning stage to adulthood. Organ weights in the reproductive canal, mean left testicular weight, mean left epididymis weight, mean weight of left vesicula seminalis and average prostate weight are as shown on table 4.
Male rats born from mother rats fed a control protein diet during the embryonal period and the uterine artery were ligated; it was followed from weaning to adulthood. Organ weights in the reproductive canal; Average left testicular weight, left epididymis mean weight, left vesicle seminalis mean weight and mean prostate weight values are shown in table 4.
Morphometric parametersThe tubular diameter and the Johnsen’s biopsy score were measured and a summary of these results are presented in table 5.
|
Groups |
Diameter of Seminiferous Tubules |
Biopsy Score |
|
Control |
249.7 ± 2.24b |
9.27 ± 0.05b |
|
Ligature |
250.3 ± 2.24b |
9.43 ± 0.04b |
|
%4 |
205.9 ± 3.04a |
8.79 ± 0.06a |
|
%12 |
245.9 ± 1.94b |
9.26 ± 0.04b |
|
Yogurt |
281.1 ± 3.35c |
9.34 ± 0.06b |
Table 5: Comparison of the diameter of the seminar tubule and biopsy scores between the groups. abc: Values with different superscripts in the same column are significantly different (P < 0.0001).
When we examine the findings according to Table 5; the findings are as follows.
Baby male rats born from mother rats fed 4% protein feed in the embryonal period; it was followed from weaning to adulthood. The mean seminiferous tube diameter and mean biopsy score of juvenile male rats are as shown in table 5.
Baby male rats born from mother rats fed 12% protein in the embryonal period were followed from milk to adulthood. It belongs to baby male rats; the mean diameter of the seminar tube and the mean biopsy score are shown in table 5.
Baby male rats born from mother rats fed with yogurt protein in the embryonal period were followed from weaning to adulthood. The mean tube diameter and mean biopsy score of the rats are shown in table 5.
Baby male rats born from mother rats fed a control protein diet were followed up to adulthood without weaning. The mean diameter of the seminary tube of juvenile male rats and the mean biopsy score are shown in table 5.
Baby male rats born from mother rats fed with a control protein diet during the embryonal period and connected to the uterine artery; it was followed from weaning to adulthood. The mean tube diameter and mean biopsy score of the juvenile male rats of this group are as shown in table 5.
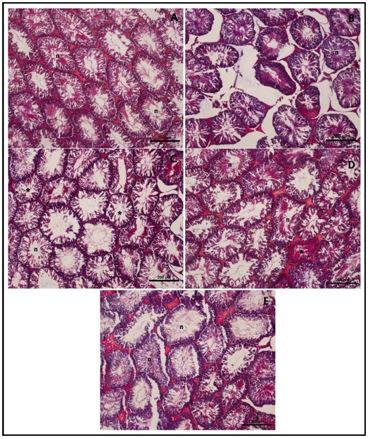
Figure 1: Light microscopic findings.
Figure 1 in the control group (24% protein diet); Seminiferous tubules (n) at different stages of normal histological structure and spermatogenesis were intensely observed (A). In the ligated group; a normal seminiferous tubule (n) density similar to the control group was detected (B). 4% in protein diet group; In addition to the normal function tubules (n), the number of atrophic and degenerative characterized seminiferous tubules (*) was found to be increased (C).
12% protein diet group; although degenerative tubules (*) were observed, there was an increase in the number of seminiferous tubules (n) similar to the control group (D).
Yogurt diet group; the presence of normal seminiferous tubules (n) was also found to be statistically higher than the control group (E).
When we examine the findings according to figure 1; the findings are as follows.
When the rats were exposed to 4% protein diet in the embryonal period and followed up to the stage of adulthood, the reproductive tissues were examined in light microscope; normally functioning tubules with atrophic and degenerative character in predetermined condition.
When the rats in 12% protein diet group were followed up to adulthood in the embryonal period and their reproductive tissues were examined by light microscopy, it was observed that there was an increase in the number of seminiferous tubules similar to the control group, although degenerative tubular tubules were observed.
In the embryonal period, when the young rats fed with yogurt and adult stage were examined, the reproductive tissues were examined in light microscope; the presence of normal seminiferous tubules and the tubular diameter were found to be higher than the control group.
The rats were fed with 24% control protein feed and the uterine arteries were ligated on the 17th day of pregnancy. The rats born after the 21st day of pregnancy were observed from embryonal period to adulthood. Reproductive tissues of these rats were examined in light microscope. The density of the seminiferous tubule (n) was determined.
Rats were fed with 24% control protein diet during the embryonal period. Until then, the reproductive tissues of these rats were examined by light microscope.
When our findings in table 3 are evaluated; the diet groups in the testis location are the control diet group, Ligature group, 4% protein diet group and yogurt groups, respectively. In sperm development in the testicular location; yoghurt group ranks 3rd after control and ligature groups. The lowest improvement rate in the development of the testicular location of the sperm was seen in the group fed 4% diet. In sperm development in the location of the epididymis; the yoghurt group from the nutrition groups took the 4th place. Vesicle seminalis in sperm development; the effect of the yogurt diet group took the second place. In sperm development, in the prostate location; while the ligature group got the highest value, the yogurt diet ranked as the 4th. Mobility of Spermium; Ligature group ranked first and yoghurt feeding group ranked fourth. Nutritional diet groups in sperm development; there was no difference in testis, epididymis, Vesicula seminalis, prostate and Motility densities. Nutritional diet groups in sperm development; testis, Epididymis, Vesicula seminalis, prostate and Motility were found to be different. No difference in density was observed. The results of the studies conducted by previous researchers support our findings [1,4,5,8]. The findings of our study on the effects of malnutrition on the central nervous system support the findings of this study [2,3,7].
According to the results of table 4, the average weight of the experimental groups was different in testis location. In comparison of subgroups in pairs; subgroup a was different from subgroup b and subgroup b was different from subgroup ab (P < 0.000). According to Epididymis location; the mean weights of the experimental groups were different (P < 0.000). According to the Vesicula seminalis location; the mean weight of the experimental groups was different.
In comparison of subgroups in pairs; group a was found to be different from subgroup b and subgroup b was different from the ab subgroup. According to the prostate location; the mean weight of the experimental groups was different. In comparison of subgroups in pairs; a subgroup was different from b subgroup.
Inadequate feeding of the offspring in the womb and breastfeeding or feeding with yogurt has a critical importance on organ development. Malnutrition prevents the development of the prostate. Ramos, Marcio and his colleagues [12], speaks of similar statements. According to Valentina Pampanini and her friends [13]; “Collectively, these results provide evidence that IUGR induced by UPI interfere with testis development, as indicated by testicular size impairment and reduced SC number in neonatal rats”.
Dongdong Xu and colleagues are working on fish farming. Feeding fish; Fluorescence and histological observations showed colonization, proliferation and differentiation of transplanted spermatogonial cells in the gonads of hybrid crackers. This study supports the results of the yoghurt diet group included in our study [14]. Liu Y., et al. To support our findings; It shows that SPAG 6 is not only a multifunctional protein that regulates sperm motility, but also plays a role in spermatogenesis in multiple cell compartments containing multiple protein partners [15]. Yi-Cheng Lu., et al. The glyco protein obtained from Mytilus edulis water extract (MWE) showed in their findings that MWE is a potential anti-obesity agent and improves testicular damage caused by obesity. The findings of these researchers were consistent with the control protein diet group, bond group and yogurt group data in our study [16]. Zhang XW., et al. in their study, to investigate the presence of spermatogenesis in protein 2 (CMTM2) mice containing a CKLF-like MARVEL trans membrane domain; He noted that CMTM2 is essential for spermiogenesis, not embryonal development in mice. The results of this study support the findings in the different diet groups included in our study [17]. "The stimulatory effects of C. aronia on circulating testosterone levels and male reproductive function are mediated by several mechanisms, including the hypolipidemic and antioxidant effect of C. aronia on HPA and possible direct stimulatory effect on HPA," Dallak M said. Fabiana A de Oliveira expressed by Dallak M [18]. Certainly; sad, "Resveratrol reduces metabolic, sperm, and testicular changes in adult Wistar rats fed a diet rich in lipids and simple carbohydrates” [19]. The results of the researchers included in sources 18 and 19 support our study. In particular, Fatemeh Namazi., et al. noted that niacin (vitamin B3) in a diet of 800 mg/kg improved serum testosterone levels and the antioxidant status of the testicles in normal rats [20]. The findings of this study are consistent with the results of our study. Simón., et al. Note that the decline in testicular yield is improved with a diet enriched with olive oil [21]. The results of this study seem to support the results of our study. 4-dihydroxybenzoic acid) is a phenolic compound commonly found in many edible fruits, vegetables, grape wines, and vegetable-derived beverages. Consequently, prepubertal exposure to PCA is safe and positively affects reproductive function in sexually mature male rats [22]. Sood San., et al. unfortunately stated that vitamin D deficiency inhibits the function of Sertoli and Leydig cells and delays spermatogenesis [23].
In conclusion, In order to prevent testicular damage, obesity should be removed first. When vitamins such as B3, D, strawberry, olive and pumpkin seeds are taken into the body, testicular damage is prevented. Adequate amount of antioxidants should be taken for testicular-sperm development. Yogurt-protein, which is necessary for healthy nutrition, contributes to sperm development.
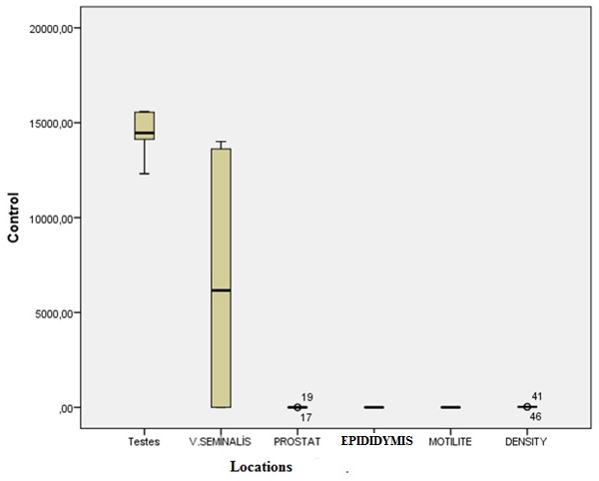
Figure 2: Distribution in the control group.
When we examine the findings according to figure 2; The findings are as follows.
In the control group, the motility of the spermium was determined as ± Std = 14416,50 ± 1208,52. At Vesicula Seminalis; values range from zero to 1500. In prostate and epididymis locations; values were observed at low level. The motility and density of the spermites were also low.
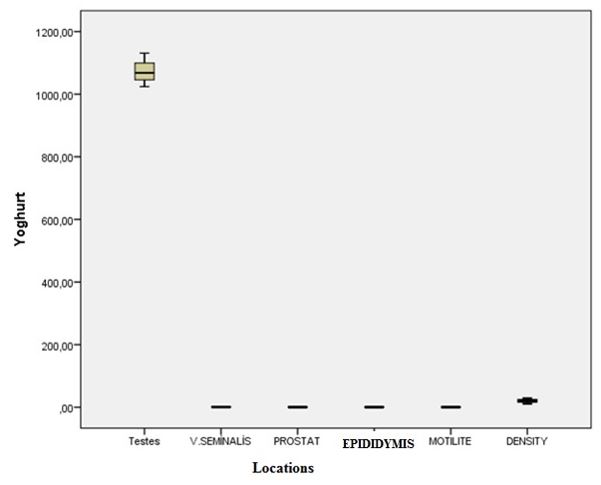
Figure 3: Distribution of yogurt in regions.
In the yogurt group, the motility and density of the spermium by location is examined; Ninety-five percent of the data is from 1000 to 1200 measurements. In Vesicula Seminalis location; the values vary in a low range. In prostate and epididymis locations; values were observed at low level. The motility of the sperm was low in the hills. Yogurt group; the density of the spermites was also low.
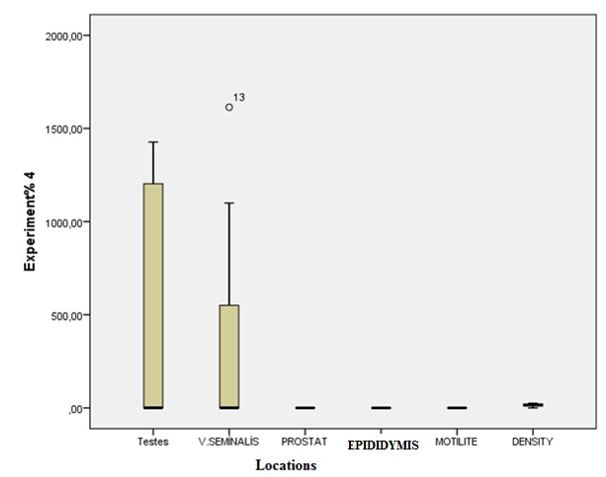
Figure 4: Distribution of experiment %4 in regions.
In the experiment 4% group, the motility and density of the spermium by location were examined; Ninety-five percent of the testis is between 0 and 1500 measurement level. In Vesicula Seminalis, it varies from zero to 1100. Low levels of prostate, epididymis and motility were observed. Low Density was also observed in Density.
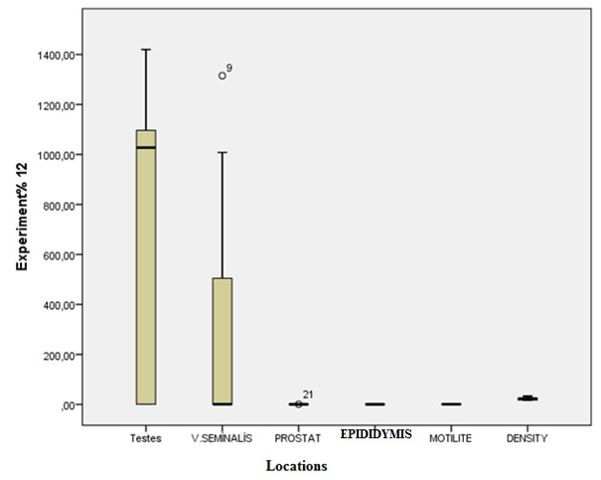
Figure 5: Distribution of experiment %12 in regions.
In the experiment 12% group, the motility and density of the spermium according to locations were examined. Ninety-five percent of the testes were between 0 and 1400. V has a near-1000 variation from vesicula Seminalis to zero. 75 percent of the data is at the level of 500. Low levels of prostate, epididymis and motility were observed. A low level of change was observed in the Density.
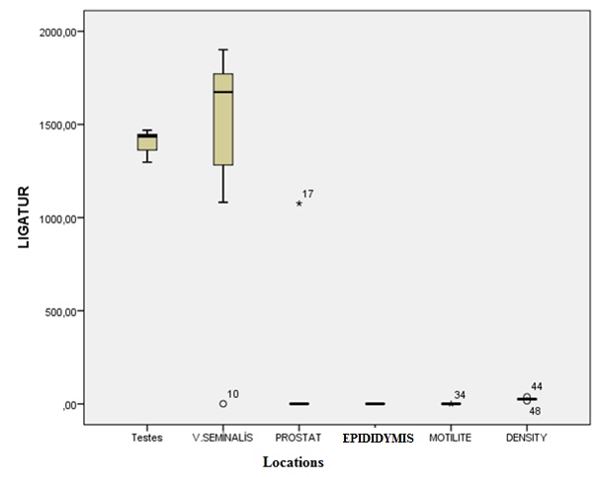
Figure 6: Distribution of ligature in regions.
In the LIGATUR group, the motility and density of the spermium according to locations is examined, ninety-five percent of the testicle is between 1300 and 1500 measurement level. It varies from 1000 to 1800 in Vesicula Seminalis. Low levels of prostate, epididymis and motility were observed. A low level of change was observed in the Density.
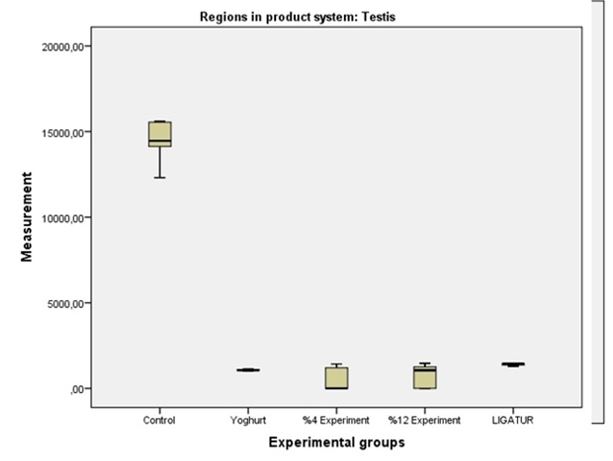
Figure 7: Distribution of testicular measurements according to experimental groups.
When the motility and density of the spermium were determined according to the locations; in the testis, ninety-five percent of the control was between 1300 and 1500 measurement level. Yoghurt has a low level of change. A visible change was observed in the 4 percent Experiment group. A low level of visible change was observed in the Experiment group of 12 percent. In the LIGATUR group, there is no change.
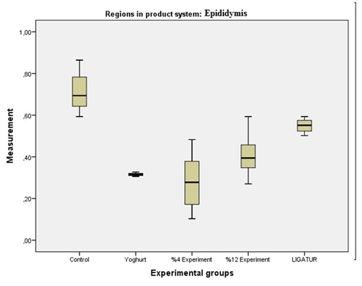
Figure 8: Distribution of epididymis measurements according to experimental groups.
When the motility and density of the spermium were determined according to the locations; epididymis, ninety-five percent of the control is from 60 to 85 measurements. Ninety-five percent of yogurt has low levels of 25 to 35 measurements. In the 4 percent Experiment group, ninety-five percent changes were observed between 15 and 50 measurement levels. Ninety-five percent of the 12 percent Experiment group showed changes in the 30 to 60 measurement levels. Ninety-five percent of the LIGATUR group is between 50 and 60 measurements.
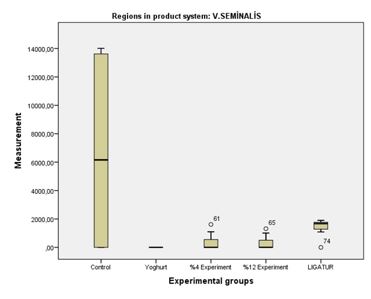
Figure 9: Distribution of V. Seminalis measurements according to experimental groups.
When the motility and density of the spermium were determined according to the locations; V seminalis, ninety-five percent in the control 0 to 1400 measurement level. Ninety-five percent of yogurt has low levels of zero measurement. In the 4 percent Experiment group, ninety-five percent changes was observed between 300 and 1500 measurement levels. Ninety-five percent of the 12 percent Experiment group showed changes in the 350 to 1500 measurement levels. Ninety-five percent of the LIGATUR group was between 150 and 1860 at the measurement level.
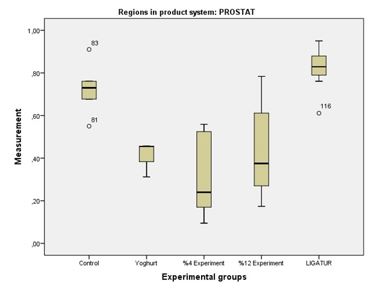
Figure 10: Distribution of prostate measurements according to experimental groups.
When the motility and density of the spermium were determined according to the locations; Prostate, ninety-five percent of the control is 0.60 to 0.78 measurement level. Ninety-five percent of the yogurt has a measurement level of 0.30 and a measurement level of 0.45. In the 4 percent Experiment group, ninety-five percent changes were observed between 0.15 and 0.55. Ninety-five percent in the Experiment group of 12 percent showed a change in the measurement level of 0, 20 to 0, and 75. Ninety-five percent of the LIGATUR group was 0.75 to 0.90.
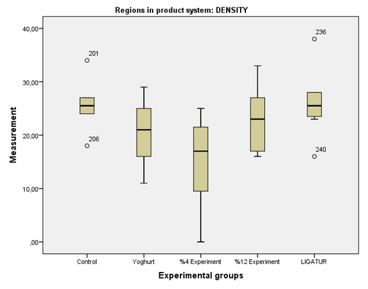
Figure 11: Distribution of density measurements according to experimental groups.
Measurements of the control group included ninety-five percent; Density was observed between 20 and 30 measurements. Ninety-five percent of yogurt; density remained in 10 to 30 levels. The % 4 experimental group remained at between 0 and 25 percent at ninety-five densities. 12% experimental group remained at 15 to 30 levels. Lastly, the LIGATUR group remained at 24 to 29.
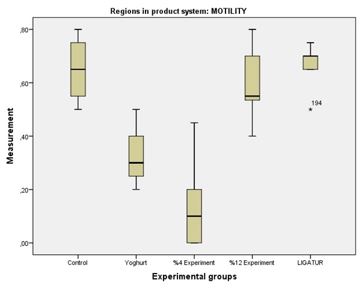
Figure 12: Distribution of motility measurements according to experimental groups.
Ninety-five percent of the control group measurements were observed in high measurements as motility. Yogurt remained at moderate levels as ninety-five motility. The% 4 experiment group remained at a low motility level of ninety-five percent. The 12% experimental group showed a parallel motility to the control group. Finally, the LIGATUR group, however, was a slingshot value, but remained in the upper levels of the control group as motility.
Citation: Vatan Kavak., et al. “Comparison of the Effects of Maternal and Postnatal Application of Protein Malnutrition, Testes Morphology and Spermatological Parameters in Adult Rats”. Acta Scientific Women's Health 3.4 (2021): 24-35.
Copyright: © 2021 Vatan Kavak., et al. This is an open-access article distributed under the terms of the Creative Commons Attribution License, which permits unrestricted use, distribution, and reproduction in any medium, provided the original author and source are credited.


 Open Access by
Acta Scientific is licensed under a Creative Commons Attribution 4.0 International License
Open Access by
Acta Scientific is licensed under a Creative Commons Attribution 4.0 International License
Based on a work at https://actascientific.com
ff
