G Harel1, R Reuveni2, M Segel2, O Inbar3, G Dubnov-Raz3 and M Scheinowitz1*
1Department of Biomedical Engineering, Tel Aviv University, Israel
2Institute of Pulmonology, Physiology and Exercise, Sheba Medical Center, Israel
3The Edmond and Lily Safra Children’s Hospital, Sheba Medical Center, Israel
*Corresponding Author: M Scheinowitz, Professor, Department of Biomedical Engineering, Tel Aviv University, Israel.
Received: March 01, 2021; Published: March 20, 2021
Pulmonary ventilation (VE) is a fundamental physiological parameter making it possible to assess exercise intensity by measuring ventilatory anaerobic threshold (VAT) during exercise stress test. Present wearable training devices do not measure VE, hence, measuring VAT during exercise testing is currently performed exclusively in the laboratory by using Cardio-Pulmonary Exercise Test (CPET) which is a costly and cumbersome equipment. This paper describes a new, wearable chest strap developed to measure pulmonary ventilation (VE) equivalent in the field. The chest strap consists of a stretch sensor measuring the breathing frequency (BF) and the relative tidal volume (VT, driven by thorax expansion), a vertical accelerometer for canceling running impacts and a heart rate monitor. The sampled data is streamed via Bluetooth link to an external computing device such as smart phone/watch or a PC where signal processing algorithms in time and frequency domains are used to filter the sampled signals and calculate the VE equivalent being the product of BF x VT.
Healthy young adults (n = 20) age 20-35 wearing the chest strap performed maximal incremental running test (using CPET) to compare between the two methods; VE measured by CPET and VE equivalent measured by the chest strap. After correcting motion artifacts the correlation between the two VE curves was very high (r = 0.94) proving the chest strap can accurately measure pulmonary attributes (BF, relative VT, and VE equivalent), during running exercise
Conclusion: The newly developed wearable chest strap measures pulmonary ventilation equivalent with high accuracy, which makes it suitable serve as a personal training device during running activity.
Keywords: Accelerometer; Breathing Frequency; CPET; FFT; Frequency-domain Analysis; Strain; Tidal Volume; Pulmonary Ventilation; Wearable
One of the major health concerns in modern time is the lack of physical activity. There is irrefutable evidence that regular aerobic activity contributes to the primary and secondary prevention of chronic diseases such as cardiovascular diseases [1], diabetes [2,3], cancer (colon, breast [4] and many others [5]), hypertension, obesity, depression and osteoporosis as well as reducing the risk for premature death [6,7], Alzheimer and dementia [8-11].
Aerobic type of exercise training improves cardiorespiratory fitness (CRF). CRF improvement is relative to exercise intensity however overexertion will cause fatigue. The most intense exercise level that can be kept for long period of time without getting exhausted is known as the Anaerobic Threshold (AT). At this point blood lactate starts to accumulate as the body lags in removing it. Buffering lactate in the blood results in CO2 accumulation which serves as a drive to increase VE. The breaking point in the VE curve during exercise stress test is known as the Ventilatory Anaerobic Threshold (VAT) and is an important non-invasive, measure of exercise intensity. Thus VE is crucial for real time estimation of exercise intensity, individual fitness level and the planning of the exercise intensity for optimal training.
In spite of all the wellness wearable devices being introduced on a regular basis, little or no attention at all is given to measure respiratory parameters. Some state of the art training vests measure breathing frequency, though breathing frequency by itself is not a reliable measure to assess VAT and provide feedback for exercise training. A recent study conducted a maximal aerobic cycle ergometer test using a cutting-edge smart shirt the Hexoskin® (Carré Technologies Inc., Montreal, Canada) found high correlation for heart rate (r ≥0.98) and breathing frequency (BF) (r ≥0.95) while having significant deviations measuring ventilation (r ≥0.69) [50].
Presently the VE is recorded by the Gold Standard Cardio-Pulmonary Exercise Test – CPET system [31] – a cumbersome and expensive equipment that provides excellent information about the individual VAT, though, under laboratory setting. As this “point” may shift to the right with training, an outdoor device is required that will allow real-time, continuous measurement of the ventilatory threshold, that will result in more efficient training and CRF improvement.
Thus, in this pilot study we aimed to develop a new, non-invasive, non-laboratory and easy to use wearable chest strap for direct real-time measurement and recording of the VE equivalent during running activity.
The concept of measuring the pulmonary ventilation (VE) using the chest strap is based on the following principles:
Using an elastic band and a load cell our chest strap measures the rib cage circumference changes which are relative to the lungs tidal volume changes and transmit the sampled VT equivalent to an external processing device such as Smartphone, while keeping it light weight, sweat proof and easy to use. Vertical acceleration is measured and transmitted allowing the processing algorithms in the external device to cancel the side effects of the running impacts and arms movements and measure accurately the breathing frequency (BF) and tidal volume (VT) equivalent which multiplication provides the desired pulmonary ventilation (VE) equivalent. Heart rate is measured, sampled and transmitted as an additional physiological parameter for fitness level evaluation.
Chest strap sub-assemblies Chest circumference changes measurementThe changes in chest circumference modify the strain of the chest strap elastic part. The strain is measured by a 1kg bridge load cell and used as chest circumference equivalent.
The load cell deformation is less than 0.5% of its total length [35]. The load cell used for the chest strap is about 10mm long thus having deformation of less than 0.05mm making it possible to measure the force applied by the stretched elastic band transferred via elastic sealing while being protected in the central processing unit waterproof encapsulation (Figure 1). The load cell measurement is filtered by a 2 pole Butterworth [38] low-pass filter.
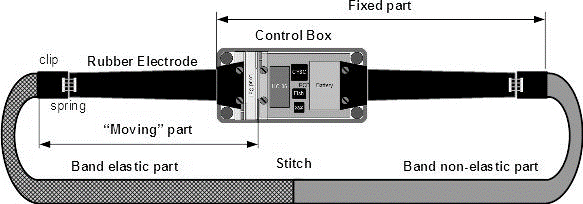
Figure 1: The elastic part of the band attached to the “moving” part of the Load Cell.
The electrical signals generated by the heart are detected on the skin surface using two conducting rubber electrodes (removed from OUTAD Wireless Heart Rate Monitor) placed on both sides of the Sternum (Figure 2). The signal levels are very weak – 0.1-1.5mV [39] at low frequency – repetition rate of 30 to 200 beats per minute or 0.5 to 3.3 beats per second with pulse width of about 20mS [40] giving a spectrum of 0.33 to 50Hz.
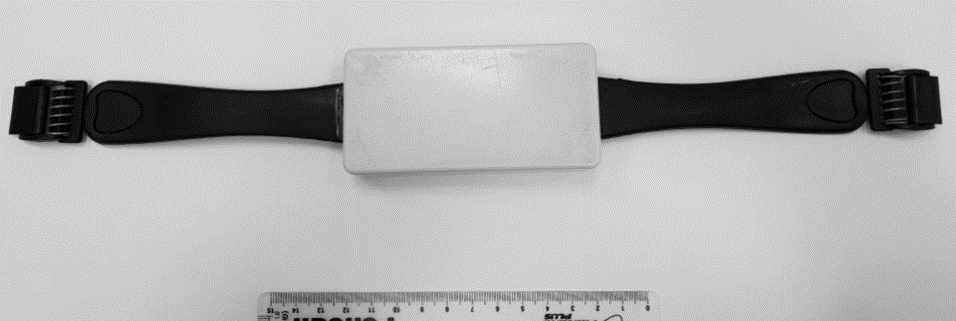
Figure 2: The chest strap control box with the two rubber electrodes on both sides.
Quantifying the vertical movements of the body during running allow the signal processing algorithms to minimize the effects of those movements on the load cell data and get a better signal to noise ratio for the chest circumference measurement.
Battery charger [41]Charging the internal 500mAh Lithium Polymer battery was done using a Qi [42] standard wireless charging receiver module as a power source with no galvanic contact. A standard commercial Qi receiver consisting of a printed loop inductor and an internal Qi protocol circuitry was attached to the internal face of the chest strap control box. By laying it on the Qi charging transmitter pad the chest strap battery is charged wirelessly (Figure 3).
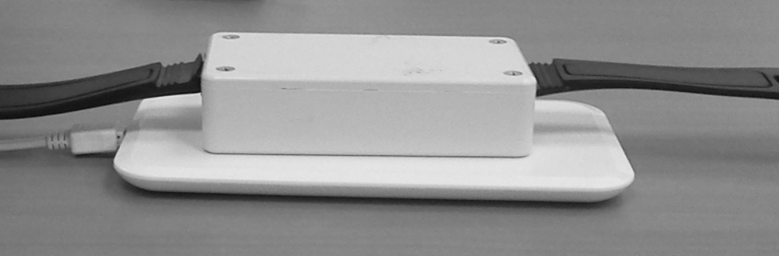
Figure 3: The chest strap being charged on Qi wireless charging pad.
A standard serial to Bluetooth module was used to perform the wireless data streaming to the external processing device. The module has a built-in 2.4 GHz antenna and a Bluetooth class 2.0 controller. Data is streamed at 9600 bps at a rate of one byte every 2.92mS.
Central processing unit (CPU)The CPU is a CY8C27443-24SXI (Cypress Semiconductors Corporation) “mixed-technology” PSOC microcontroller. The analog blocks build the amplifiers, comparators, analog to digital and digital to analog converters and switched capacitor filters while the digital blocks build counters, timers and the UART (Universal Asynchronous Receiver Transmitter) used for the Bluetooth serial communication.
Signal processing algorithmThe running vertical impacts are sensed by the chest strap adding strain surges to the breathing signal.
The noisy sampled strain (Figure 6) and vertical acceleration signals (Figure 5) streamed via the Bluetooth link from the chest strap are received by the external computing device for further processing. The signal processing algorithms filter the strain signals, remove the running movements’ noise, measure the breathing frequency (BF) and the relative tidal volume (VT) and multiply them to get the desired pulmonary ventilation (VE) equivalent values and curve.
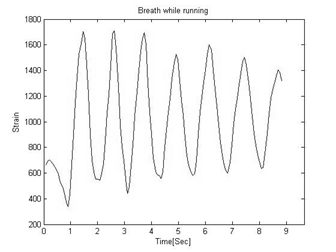
Figure 4: An Example of strain signal during normal breathing.

Figure 5: Vertical acceleration signal of the running impacts.
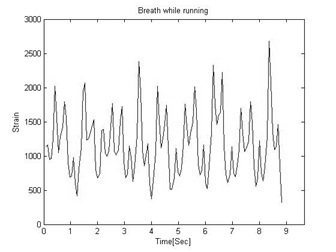
Figure 6: The raw strain signal as a combination of breathing and running impacts.
128 samples Fast Fourier Transform (FFT) generates the frequency spectrum of the signal, used by the signal processing algorithm to separate between the breathing signal and the running impacts and measure the breathing frequency (BF) and its relative amplitude (VTr).
The spectrum includes the spectral components of the running impacts which are separately sampled by the vertical accelerometer as seen on the plot in figure 7.
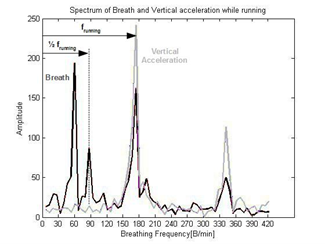
Figure 7: Pelvic movement frequency at half the running frequency f running.
One more significant spectral component is located at exactly half the running impacts frequency (Figure 7). This frequency represents the pelvic movement [43,44], (Figure 8) combined with arms movement which affects the elastic band measurement as well. For two running steps performed by the two legs, the upper part of the body moves once from side to side adding a motion at half the frequency of the legs movement (Figure 8).
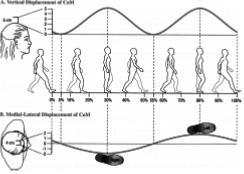
Figure 8: For every two steps by both legs the upper body moves one cycle.
The vertical acceleration spectrum (Figure 7) identifies the spectral components of the running impacts on the breathing spectrum (Figure 7) and enables the signal processing algorithm to calculate the pelvic movement frequency as well and remove them both from the breathing spectrum (Figure 9).
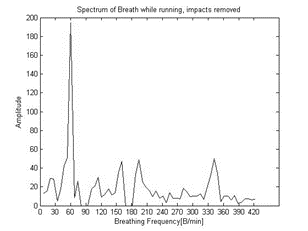
Figure 9: Strain signal from which running impacts harmonies and pelvic motion were removed.
Hamming window was used by the algorithm to reduce the side lobe to -43dB [46] (0.71%) improving significantly the possibility of detecting the breathing frequency.
Measuring breathing frequency (BF) and relative tidal volume (VTr)To improve breathing frequency (BF) measurement accuracy, the weighted average of the maximal energy bin and the highest neighboring bin was used as the approximated value.
Based on Parseval's theorem the estimated breathing spectral component energy level is relative to the sum of the squared amplitudes of the neighboring bins. Experiments defined an optimum of 4 bins before and after the strongest amplitude bin. BF harmonies were neglected as they are too small to be considered. The relative Tidal Volume (VTr) is the square root of that energy.
Pulmonary ventilation equivalent (VEe) is the product of their multiplication VEe=VTr * BF (Figure 10).

Figure 10: Ventilation (VE) is the product of Tidal Volume (VT) time Breathing Frequency (BF).
In the chest strap, analog signals from the three sensors – load cell sensing the strap stretch, rubber electrodes sensing the heart electric signals, and the accelerometer sensing the vertical acceleration, are filtered and converted into digital values.
The digital values are serially transmitted by the Bluetooth radio transceiver.
The streamed data is received via the Bluetooth link by the external processing device such as a laptop computer, Smartphone or smart watch, where data is processed in real time to generate the relative Tidal Volume (VT) and Breathing Frequency (BF) which product is the pulmonary ventilation equivalent (VE).
Simultaneously, the heart rate is measured and reported (Figure 11).
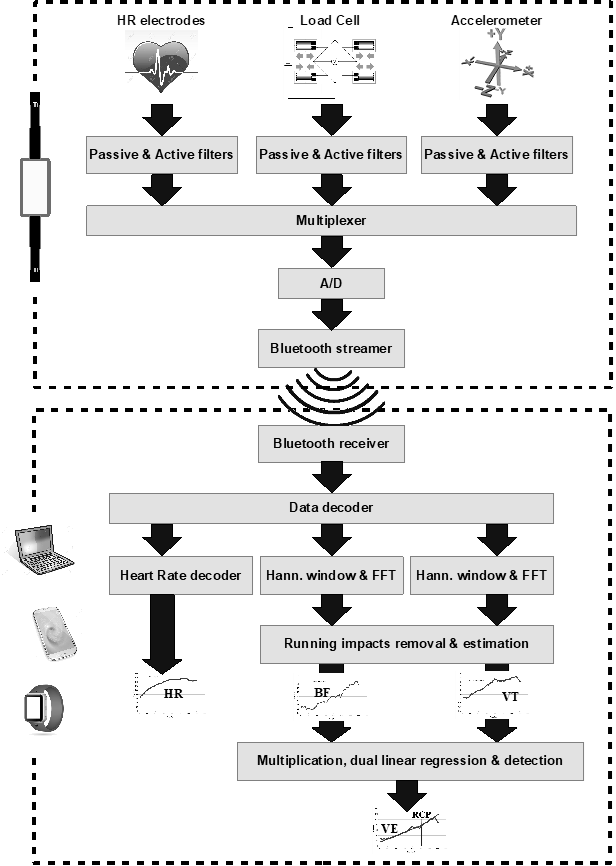
Figure 11: Sensors’ signals processed and streamed via Bluetooth to external devices for post processing.
The chest strap was tested and validated against CPET – the known Gold Standard device. The test was performed by Nspire Health Inc. ZAN® 600 CPET and Medisoft Group RAM 770CE treadmill, at the cardiopulmonary exercise test laboratory in the Edmond and Lily Safra Children’s Hospital, Sheba Medical Center, Israel, approved by the Helsinki Ethics Committee (No. 2066-15-SMC).
A sample size of 20 subjects was selected for this pilot study (age range 20-35 year), which included 10 males and 10 females, normal weights (BMI ranging between 17 and 26. Each volunteer, wearing the chest strap ran on a treadmill while connected to ECG electrodes and wearing a face mask for breathing gas analysis (Figure 12) as part of the standard CPET procedure.
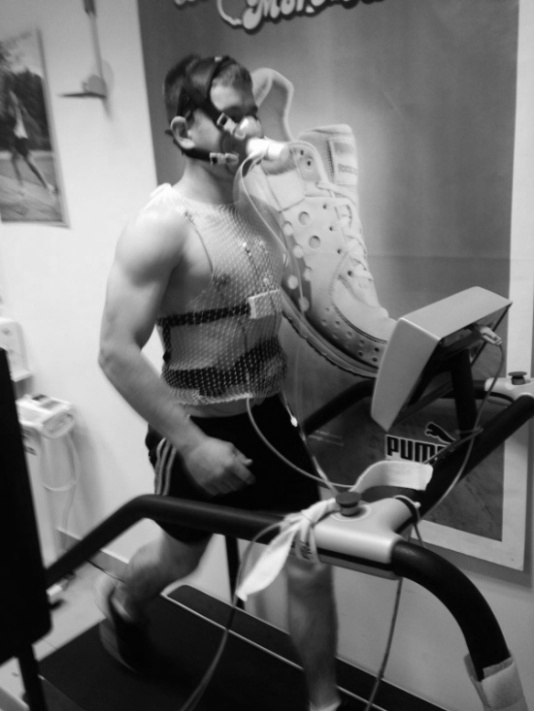
Figure 12: Male subject wearing the chest strap running on treadmill connected to the CPET.
Data from the chest strap was wirelessly received, processed, analyzed and recorded by a DELL XPS laptop computer.
Work load was gradually increased following the Bruce protocol [47,48] every 3 minutes.
For male subjects the test started 3 minutes at a walking speed of 7km/h accelerating to 3 minutes at a running speed of 8km/h followed by 3 minute steps of 9km/h and 10km/h which remained as the running speed till the end of the test. The running angle was then increased every 3 minutes by 2%, estimated to be equal to raising the level of stress by incrementing the speed by 1km/h. The test was normally terminated when the Respiratory Exchange Ratio (RER) exceeded 1.2, indicating near-exhaustion condition, or alternatively if aborted by the subject due to exhaustion.
For female subject the test was similar, starting at a lower speed of 6km/h and maintaining a steady speed of 8km/h.
The CPET equipment recorded the physiological parameters, continuously, breathing rate, tidal volume and ventilation which were used later for comparison with the equivalent parameters recorded by the laptop computer.
Fitness levels, indicated by VO2max (maximal oxygen uptake), was above the predicted level. Average VO2max for females (Table 1) was 44.1 with standard deviation of 5.3 ml/(kg*minute), and average of 53.9 ml/(kg*minute) with standard deviation of 10.6 ml/(kg*minute) for males (Table 2).
| # | Initials | Gender | Age | Height | Weight | BMI | VO2max | Predicted |
|---|---|---|---|---|---|---|---|---|
| cm | kg | kg/m2 | ml/(kg*min.) | % | ||||
1 |
GM |
F |
22 |
156 |
55 |
22.6 |
47.8 |
151 |
2 |
NP |
F |
26 |
165 |
64 |
23.5 |
45.6 |
152 |
3 |
IM |
F |
27 |
164 |
58 |
21.6 |
44.8 |
149 |
4 |
HK |
F |
26 |
168 |
54 |
19.1 |
36.3 |
132 |
5 |
CG |
F |
30 |
164 |
55 |
20.4 |
52.5 |
178 |
6 |
ET |
F |
29 |
165 |
46 |
16.9 |
- |
- |
7 |
LT |
F |
32 |
163 |
60 |
22.6 |
48.0 |
169 |
8 |
GN |
F |
27 |
163 |
58 |
21.8 |
43.6 |
145 |
9 |
NK |
F |
30 |
168 |
59 |
20.9 |
41.3 |
142 |
10 |
SM |
F |
30 |
165 |
72 |
26.4 |
36.9 |
125 |
min. |
22 |
156 |
46 |
17 |
36 |
125 |
||
max. |
32 |
168 |
72 |
26 |
53 |
178 |
||
mean |
27.9 |
164.1 |
58.1 |
21.6 |
44.1 |
149.2 |
||
SD |
2.9 |
3.3 |
6.8 |
2.6 |
5.3 |
16.5 |
Table 1: Individual data of the female subjects.
| # | Initials | Gender | Age | Height | Weight | BMI | VO2max | Predicted |
|---|---|---|---|---|---|---|---|---|
| cm | kg | kg/m2 | ml/(kg*min.) | % | ||||
1 |
AE |
M |
25 |
176 |
80 |
25.8 |
49.8 |
121 |
2 |
DR |
M |
25.5 |
174 |
73.5 |
24.3 |
45.7 |
112 |
3 |
OS |
M |
26 |
176 |
74.5 |
24.1 |
58.2 |
144 |
4 |
RD |
M |
34 |
178 |
68 |
21.5 |
46.3 |
123 |
5 |
NG |
M |
31 |
178 |
81 |
25.6 |
50.1 |
128 |
6 |
GG |
M |
31 |
178 |
74 |
23.4 |
49.2 |
126 |
7 |
EK |
M |
28 |
170 |
71 |
24.6 |
63.8 |
161 |
8 |
IT |
M |
34 |
181 |
88 |
26.9 |
56.3 |
149 |
9 |
AB |
M |
27 |
172 |
66 |
22.3 |
41.9 |
104 |
10 |
AM |
M |
26 |
178 |
77 |
24.3 |
77.8 |
192 |
min. |
25 |
170 |
66 |
21 |
42 |
104 |
||
max. |
34 |
181 |
88 |
27 |
78 |
192 |
||
mean |
28.8 |
176.1 |
75.3 |
24.3 |
53.9 |
136.0 |
||
SD |
3.5 |
3.3 |
6.5 |
1.6 |
10.6 |
26.1 |
Table 2: Individual data of the male subjects.
BF, VTe and VEe curves were highly correlated with the CPET, as seen in figure 13.

Figure 13: An example of BF [r=0.984] VT [r=0.984] and VE = VT x BF [r=0.988] between CPET and chest strap.
| rVT | rBF | rVE | 1- rVE | ||
|---|---|---|---|---|---|
1 |
M |
0.977 |
0.963 |
0.987 |
0.013 |
2 |
M |
0.933 |
0.979 |
0.987 |
0.013 |
3 |
M |
0.973 |
0.979 |
0.983 |
0.017 |
4 |
F |
0.977 |
0.987 |
0.980 |
0.020 |
5 |
M |
0.957 |
0.974 |
0.992 |
0.008 |
6 |
M |
0.344 |
0.992 |
0.909 |
0.091 |
7 |
F |
0.980 |
0.995 |
0.995 |
0.005 |
8 |
F |
0.942 |
0.967 |
0.975 |
0.025 |
9 |
M |
0.850 |
0.988 |
0.963 |
0.037 |
10 |
M |
0.962 |
0.990 |
0.989 |
0.013 |
11 |
F |
0.892 |
0.991 |
0.981 |
0.019 |
12 |
F |
0.984 |
0.984 |
0.988 |
0.012 |
13 |
M |
0.892 |
0.973 |
0.962 |
0.038 |
14 |
F |
0.974 |
0.953 |
0.985 |
0.015 |
15 |
M |
0.898 |
0.995 |
0.986 |
0.014 |
16 |
M |
0.973 |
0.983 |
0.986 |
0.014 |
17 |
F |
0.977 |
0.991 |
0.990 |
0.010 |
18 |
F |
0.969 |
0.992 |
0.988 |
0.012 |
19 |
F |
0.948 |
0.988 |
0.971 |
0.029 |
20 |
F |
0.890 |
0.995 |
0.985 |
0.015 |
Mean |
0.914 |
0.983 |
0.979 |
||
STD |
0.140 |
0.012 |
0.019 |
Table 3: Correlation between CPET and chest strap recorded curves.
The CPET results in comparison with those recorded by the chest strap, listed in table 3 show very high correlation for BF curve (rBF mean = 0.983), VTe curve (rVT mean = 0.914) and VEe calculated curve (rVE mean = 0.979).
For better visual impression the complement values 1-rVE were used on a bar chart (Figure 14). It can be noticed that the majority of the VEe curves (n = 15) have a better correlation than the average, and only one test stands out with the highest value of 1-rVE[6]=0.091 for the lowest correlation (rVE[6] =0.909)
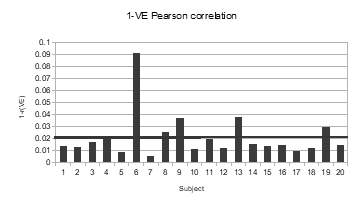
Figure 14: Bar chart of 1-rVE results.
We developed a new wearable chest strap that measure pulmonary ventilation during running exercise. In this pilot study, we found very high correlation between breathing frequency, tidal volume equivalent and calculated pulmonary ventilation (equivalent) between the chest strap and the gold standard CPET.
Our wearable chest strap was built with a load cell based on strain gauges, characterized by long term and temperature stability, linearity and high sensitivity. This device, when wearing on the chest, detects small changes in the chest circumference, which increases gradually with increased exercise intensity. These changes reflect both breathing frequency and the equivalent of tidal volume. The combination of the two is the equivalent of pulmonary ventilation. Since breathing during exercise is mostly performed by the chest, this wearable device can intuitively be a reliable and accurate device for breathing measurement during exercise.
The signal processing algorithms in the external computing device had to tackle running conditions, especially detecting and canceling the arms and pelvic movements. This was achieved by utilizing an accelerometer in the chest strap to measure the running impacts frequency and by operating a Fast Fourier Transform (FFT) in the external device to generate the signal spectrum and allow the body movements to be detected and removed. On the reconstructed spectrum, breathing frequency and tidal volume equivalents were measured and multiplied to get an accurate equivalent VE values.
Using strain gauge combined with wireless charging of the internal Li-Polymer battery allowed the complete sealing of the device, making it waterproof, which is highly important during high intensity training accompanied by extensive sweating.
In light of the increasing demand for personal training level monitoring, advanced wearable devices were introduced. One such device is the Zephyr BioModule attached to the front of a compression shirt to measure and monitor both physiology and accelerometry [2]. In addition to its advantages, one of its drawbacks is the fact that it only measures breathing rate which is not sufficient to calculate pulmonary ventilation.
BSX insight wearable muscle oxygen monitor sleeve is a wearable device that looks inside the calf muscle to read real-time muscle oxygen levels from which lactate thresholds [3] are deducted. It does not measure directly the lactate levels but rather use assessment algorithms calibrated on athletes. Furthermore, it is not yet proven whether oxygen levels and fatigue in a single muscle represent the stress levels of the cardiopulmonary system.
The combination of the high quality state of the art hardware with the sophisticated signal processing algorithms developed in the current study, resulted in a very high agreement (r = 0.98) between the ventilation equivalent curves recorded by the chest strap and the ventilation data recorded by the gold standard CPET tested on 20 subjects under laboratory settings.
We cannot measure small changes in breathing that are diaphragm dependent.
We evaluated our device on young, healthy individuals. We must repeat the experiment on patients with pulmonary diseases.
The authors are thankful to Dr. Abhay Dharamsi – Principal, Parul Institute of Pharmacy and Dean, Faculty of Pharmacy, Parul University for his motivation and support in completing the entire study. The authors are also thankful to Parul Institute of Pharmacy for providing the gift sample and for providing all the requirements and equipment’s for conducting the study.
Citation: M Scheinowitz., et al. “A Newly Developed Wearable Chest Strap for Measuring Pulmonary Ventilation During Exercise". Acta Scientific Pharmaceutical Sciences 5.4 (2021): .
Copyright: © 2021 M Scheinowitz., et al. This is an open-access article distributed under the terms of the Creative Commons Attribution License, which permits unrestricted use, distribution, and reproduction in any medium, provided the original author and source are credited.


 Open Access by
Acta Scientific is licensed under a Creative Commons Attribution 4.0 International License
Open Access by
Acta Scientific is licensed under a Creative Commons Attribution 4.0 International License
Based on a work at https://actascientific.com
ff
