Miguel Martell*
Department of Neonatología-Hospital de Clínicas, Universidad de la República, Uruguay
*Corresponding Author: Miguel Martell, Department of Neonatología-Hospital de Clínicas, Universidad de la República, Uruguay.
Received: March 29, 2022; Published: April 28, 2022
Citation: Miguel Martell. “Growth: Postnatal Growth Rate”. Acta Scientific Paediatrics 5.5 (2022): 52-57.
Growth and development are the most important biological sensors to detect the state of health in the individual and in the population. The strategy for implementing continuous monitoring in the evolution of these two parameters must be carefully evaluated. The interaction between growth, development and education is responsible for the socio-cultural formation of the individual and his integration into society. Any measure of measuring the variable can be used, but some are more advantageous such as the rate of growth per unit in preterm and low birth weight.
Keywords: Postnatal; Growth Rate; Birth Weight; MGVU.
At the Latin American Center for Perinatology, the median growth velocity per unit (MGVU) [1] was used to have better information on the growth of the different parameters and to better manage their nutritional needs.
Median growth velocity (MGV) and median growth velocity per unit (MGVU) of body size are defined. The authors stress that: (a) growth velocity is related to body mass, (b) a useful evaluation of growth is made by using two consecutive measures with a certain time interval independently of birthweight and gestational age, and (c) expressing growth per day per unit relates well to daily nutritional and other requirements.
The growth rate expresses the gain or increase of a parameter in a variable time. It is what a clinician does in the repeated control of a child has a profile of how the growth is going and according to that result takes the measures he deems appropriate. The problem you may have is that the parameters can be very different for the same age and this can only be helped with the child’s history and their own experience. In preterm and or low weight for age newborn it can be used to evaluate the grams it grows per day.
Another way to study growth velocity is (MGVU). It expresses the daily gain per unit; that is, the increase in grams per day and per kilogram of body weight; increase in centimeters per day, for each centimeter of size, and increase in centimeters per day, for each centimeter of the cranial perimeter.
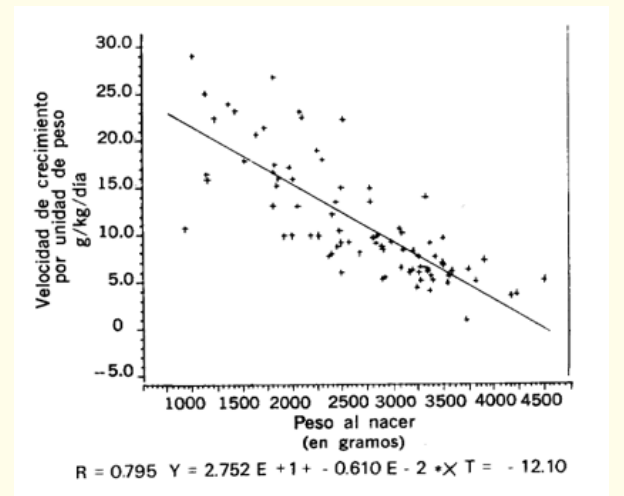
The (MGVU) is determined based on the previous value. With this methodology in the CLAP [1,2] three growth parameters (weight, height and cranial perimeter) were studied for a period of 24 months for 112 children that was formed by three groups of newborns: 48 born of term and weight adequate for gestational age (NTPA), 40 of preterm with adequate weight (NPPA) and 24 born with low weight for age (NTBP). There is a statistically significant inverse correlation between weight and (MGVU). Smaller is the larger size is the growth which allows the catch-up to occur. Figure 1. Shows an example of the growth of (growth rate per unit (grams per kilo per day) at two months of age for different birth weight. Table 1 shows the speed of different weight interval values and the percentile distribution for each of them.

Figure 1: An inverse correlation between VCU and birth weight is observed at 2 months.
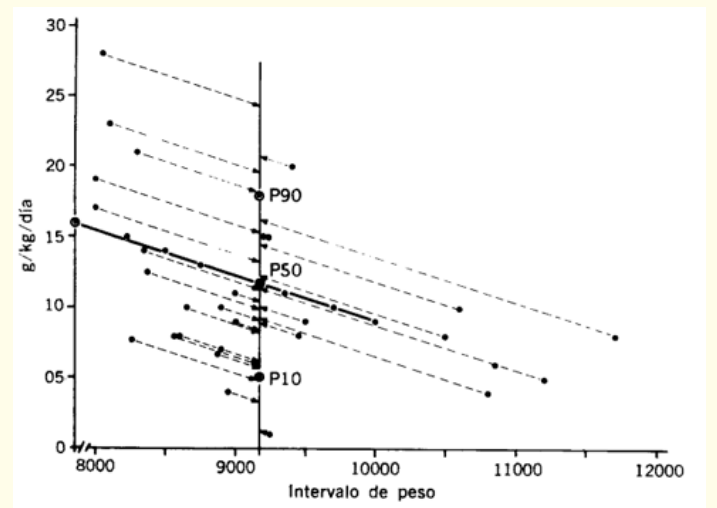
For this study, the interval of the independent variable (abscissa variable) was divided into class intervals, and in each one a linear regression was performed with the values of the mean growth rate per unit (VMC/U) of that interval. For each of the observations, this procedure allowed to calculate a theoretical value of the average velocity per unit, corresponding to the average value (of the independent variable) within its interval (theoretical values of the ordinate corresponding to the abscissa of the barycenter in this case was 9.54 kilos). This procedure is based on the method used by Wingerd [3]. Figure 2 shows as an example the procedure applied to the weight variable. Individuals of the same interval were then considered as having the same value as the abscissa, which allowed to estimate percentiles (10,50 and 90). Table 1 and Figure 3 show an example for weight. For the size and cranial perimeter, the same procedure was used (19).

Figure 2: Procedure to calculate the 10th, 50th and 90th percentiles of the VCU for the average weight range between 8 and 12 kilos.

Table 1: Range of previous weight, median and percentiles of the VCU in g/day/kilo.
These tables were constructed for weight, height, and cranial perimeter based on growth rate per unit (22). It was shown that when the (growth rate per unit) VCU is between the 25th and 75th percentile of the VCU of any parameter, the child’s growth band remains between the 10th and 90th percentile of the growth curves (curves as a function of age; weight for age, height for age and cranial perimeter for age). If in a single control it is below the 25th percentile and in the following controls it is above, the growth is normal. If it repeatedly grows with a VCU lower than the 25th percentile, the growth trend will be negative with respect to the reference curves. If the rate of growth is above the 75th percentile, repeatedly the growth of the age-based curves will be greater than the 90th percentile. When it grows with the 75th percentile it follows the growth line of the 90th percentile.
Using the P25; P50; and P75 percentiles of the VCU, 2 types of tables were constructed for the 3 parameters (22). They can be built for different intervals: days, weeks or months. The VCU is also calculated with the value in Table 1. These tables are built to facilitate the work of the person who controls the child.
VCU percentile x previous value* x 30= monthly increment(Formula 1)
*Previous value: is the value from which the increment is taken; it can be birth weight or at any age.
Can be any value. The 25th, 50th and 75th percentiles that are associated with the 10th, 50th and 90th percentiles of the growth curves as a function of age are usually taken (Table 1. For weight).
To better understand this methodology, an example is presented with the weight assessment.
To estimate the 10th percentile of the weight curve as a function of age (distance curve), the P25 percentile of the VCU was used, to estimate the P50 percentile of the weight, the P50 percentile was used and to estimate the P90 percentile the P75 percentile and the V CU was used. Example 1 shows the use of this methodology for a child weighing 1500 g (1.5 kg because the unit is the kilo).
VCU percentile x previous value x 30 = Monthly increment VCU percentile: The P25, P50 and P75 percentile of the VCU is 9.8, 14.4 and 19.1 g/k/day respectively.
1.5 kg Calculation of the increase in 30 days for the 25th percentile of VCU, whose value is: 9.8 g/k/day Monthly increment = 9.8 x 1.5 x 30 = 441g
This value is added to the previous one (1500 + 441) and you have the weight per month, which corresponds to 1941 g. This means that if this child grows for 30 days with a velocity corresponding to the P25 percentile of VCU, it will weigh 1941 g. We proceed in the same way to calculate the P50 percentile and the P90 percentile of the weight per month, using the P50 percentile and the P75 percentile of the VCU (the VCU values are taken from table 1.Table 2 summarizes Example 1.

Table 2: Example of the estimation of the weight in 30 days estimation of the weight in 30 days.
*This value is obtained by adding the increase to the previous weight that was 1500.
In this way it is estimated that the monthly increase in weight for a child weighing 1500 grams, will be between 440 and 860 g. This is the speed by increment. In general, children do not have a uniform rate of growth, but it is variable; this is why the interval that the child should grow should always be estimated. It has been shown that if a child grows up with a fixed VCU percentile, for example the P25, the child will always be in the P10 percentile of the weight-for-age curves (distance curve). Example 2 (Table 3) shows the values of the P10, P50 and P90 percentiles of the expected monthly increment.
Using the same methodology, an expected monthly increment table was constructed with weight intervals of 100 g from 600 g to 12,000 g. Table 4 only describes the expected monthly increase from 600 g. Given the percentage of initial weight loss and the days it takes to regain birth weight, these values are valid from the second month of life. Weight values less than 1400 g usually correspond to children who are in intensive care and often have some type of complication or digestive intolerance and growth should be evaluated day by day.

Table 3: Monthly increment of the example.
The monthly weight gain tables estimate the expected increase in a child whose weight can range from 600 to 12,000 g (see Table 4). For example, if you have a child of 5000 g and in 30 days he increased 600 g, it can be said that his weight gain is a little greater than the 10th percentile of the rate per increment. If you look from another point of view you have that a child of 5000 g is expected to increase in 30 days between 570 and 930 g. No matter the age only the weight matters.
Using the same methodology, increment tables were constructed for the size and cranial perimeter. For the size, the increase was estimated every 2 months from 44. to). for the cranial and the perimeter and height increase was calculated monthly.
Using the same methodology, a table of expected monthly increase was constructed with weight intervals of 100 g from 600 to 12,000 g (see table 4). using the VCU data with which Figure 5 was constructed.
Table 4
The use of this methodology is useful for monitoring preterm and underweight children. It is important to know that if the child follows the growth assessed by this method, he or she reaches the catch up around 2 years of age.
Another aspect to note is that a few years ago, neonatal units competed for who ever reached growth recovery faster, for which it was a matter of accelerating growth with hypercaloric diets at the expense of carbohydrates or medium-chain triglycerides that can reach produce high values of plasma glucose that, on the one hand, is stored as fat that leads to obesity and would even lead to insulin resistance and cardiovascular alterations in the future [4-6]. It is recommended to avoid growth acceleration because it would have negative consequences on health in these children. It is very important to bear in mind that when monitoring the growth of weight, height and head circumference, a panniculus measurement is added to control excess fat. It is also a factor that makes these children require follow-up due to the metabolic or endocrine alterations that they may suffer in early or late childhood (18). For all these reasons it is important to know the rate of growth of this group of children.
Copyright: © 2022 Miguel Martell. This is an open-access article distributed under the terms of the Creative Commons Attribution License, which permits unrestricted use, distribution, and reproduction in any medium, provided the original author and source are credited.
ff
© 2024 Acta Scientific, All rights reserved.