Oyamakin S Oluwafemi1*, Bobadoye Dotun2 and Alabi Y Ifeoluwa3
1Biostatistics Unit, Department of Statistics, University of Ibadan, Nigeria
2Forestry Research Institute of Nigeria, Nigeria
3Global Emerging Pathogens Treatment Consortium (GET), Nigeria
*Corresponding Author: Oyamakin S Oluwafemi, Biostatistics Unit, Department of Statistics, University of Ibadan, Nigeria.
Received: October 03, 2020; Published: January 22, 2021
Citation: Oyamakin S Oluwafemi., et al. “On the Effect of Meteorological Parameters on the Spread of COVID-19 with Count Methodologies”. Acta Scientific Paediatrics 4.2 (2021): 29-36.
There are confusion as to whether cold/hot weather can kill the new coronavirus (COVID-19) since most infectious disease have some form of seasonality and/or seasons at which they progress. The normal human body temperature remains around 36.5°C to 37°C, regardless of the external temperature or weather. This paper considered the relationship between the weather parameters and the spread of COVID-19 since many of the largest outbreaks have been in regions where the weather is cooler, leading to speculation that the disease might begin to tail off with the arrival of summer. Many experts, however, have already cautioned against banking too much on the virus dying down over the summer. The results based on the active and closed cases of COVID-19 showed that infected patients in mild condition and serious/critical condition under the active cases as at today 1st of April 2020 were 95% and 5%, respectively while 81% (Recovered/discharged) and 19% (Deaths) were observed under the closed cases which was 229,344 in total as at 1st of April 2020. Also, the correlation coefficients showed that no relationship existed between the meteorological variables and the confirmed cases counts due to COVID-19. Count methodologies used showed significance of the weather parameters but gave a poor fit which is an indication of data needs as covariates to the already documented records of persons diagnosed to be COVID-19 positive.
Keywords: COVID-19; Meteorological Parameters; Poisson Model; Negative Binomial Model; Correlation Coefficients
Coronavirus disease (COVID-19) caused by a newly discovered novel coronavirus is an infectious disease [1]. Mild to moderate symptoms and recovery without special treatment are what most people who fall sick with COVID-19 experience [1,2]. COVID-19 is mainly transmitted through droplets generated when an infected person coughs, sneezes, or exhales. These droplets are too heavy to hang in the air and quickly fall on floors or surfaces [2]. It has been discussed at different levels how one can be infected, which is majorly by breathing in the virus if you are within proximity of someone who has COVID-19, or by touching a contaminated surface and then your eyes, nose, or mouth. Various strategies have since been put in place by affected countries. These included the regular use of face masks, social distancing, washing of hands regularly and staying indoor among others. Most of these strategies are difficult to implement in Africa due to our limitations in terms of health infrastructures, the culture of buying and selling, modes of transportation and bad data management policies among others. The Nigeria Centre for Disease Control (NCDC) through the national Emergency Operations Centre (EOC) has continued to lead the national public health response in Nigeria under the supervision of the Federal Ministry of Health and oversight of the Presidential Task Force on COVID-19 (PTF-COVID-19). The NCDC is also working closely with all states of the Federation to support their response activities to the outbreak. Several measures have been instituted by the Federal Government of Nigeria through the PTFCOVID-19 together with the Federal Ministry of Health to curtail the spread of the disease and protect the health of Nigerians. This includes an initial lockdown of non-essential activities; closure of schools; a ban on international flights etc.
Many infectious diseases are perceived to be seasonal thereby showing great relationships with weather parameters. Flu typically arrives with the colder winter months, as does the norovirus vomiting bug. Others, such as typhoid, tend to peak during the summer. Measles cases drop during the summer in temperate climates, while in tropical regions they peak in the dry season. Hence, it is important to know whether we can expect similar seasonality with Covid-19. Since it first emerged in China around mid-December, the virus has spread quickly, with the number of cases now rising most sharply in Europe and the US. This paper considered the relationship between the weather parameters and the spread of COVID-19 since many of the largest outbreaks have been in regions where the weather is cooler, leading to speculation that the disease might begin to tail off with the arrival of summer. Many experts, however, have already cautioned against banking too much on the virus dying down over the summer.
Some models were selected for the reported cases and deaths since the reported cases and number of deaths are count data. Models like Poisson regression model, Negative Binomial model and Zero truncated Poisson regression model are employed to model the reported cases while hurdle model and Zero Inflated Poisson model to model the reported death cases.
The data on coronavirus comprises of the reported cases, the number of death and countries which the disease was reported [1]. In figure 1 below, the countries were grouped into continents comprising of 26 countries in Asia, 7 in America, 1 in Australia, 30 in Europe and 3 in Africa.
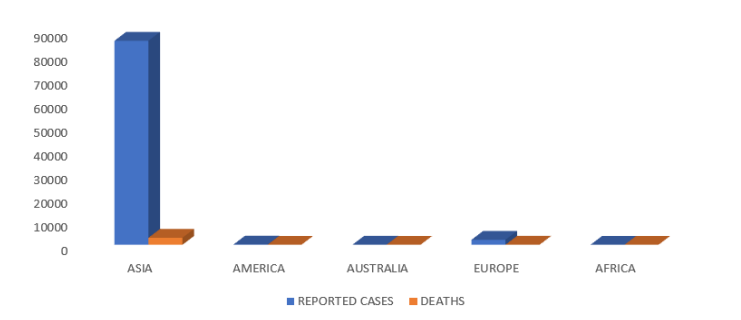
Figure 1: Distribution of reported cases and deaths due to COVID-19 by continents.

Table 1: Descriptive statistics of the variables.
Table 1 above showed that there is over dispersion in the variables since the variance is larger than the mean. This is another reason of our choice of selected model.
The zero inflated poisson regression model and the hurdle model are used to model the reported death cases because it has an excess zero counts. Theory suggests that the excess zeros can be modeled independently. Thus, the ZIP and the hurdle model has two parts, a Poisson count model and the logit model for predicting excess zeros. Asia was chosen as the reference category.
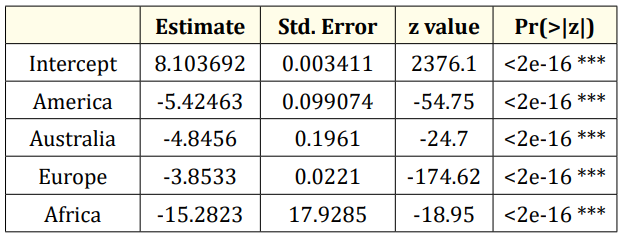
Table 2: Modelling reported cases of coronavirus using zero truncated poisson regression model. Signif. codes: 0 ‘***’ 0.001 ‘**’ 0.01 ‘*’ 0.05 ‘.’ 0.1 ‘ ‘ 1.
Table 2 suggests that if a coronavirus case is to be reported, the expected number of reported cases is expected number of reported cases in America will decrease by 5.4246 times compare to Asia while holding other variable in the model constant. Also, the expected number of reported cases is expected to decrease by 4.8456 times in Australia compare to Asia while holding other variable in the model constant. The expected number of reported cases is expected to decrease by 3.8533 times in Europe compare to Asia while holding other variable in the model constant. Finally, the expected number of reported cases is expected to decrease by 15.2823 times in Africa compare to Asia while holding other variable in the model constant. The table also shows that there is a significant difference between the reported cases in Asia compare to other continent since their P-value is less than 0.05 level of significance.
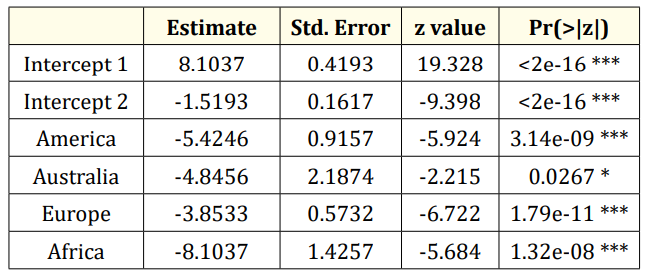
Table 3: Modelling reported cases of coronavirus using negative binomial regression model. Signif. codes: 0 ‘***’ 0.001 ‘**’ 0.01 ‘*’ 0.05 ‘.’ 0.1 ‘ ‘ 1.
Table 3 suggests that if a coronavirus case is to be reported, the expected number of reported cases is expected number of reported cases in America will decrease by 5.4246 times compare to Asia while holding other variable in the model constant. Also, the expected number of reported cases is expected to decrease by 4.8456 times in Australia compare to Asia while holding other variable in the model constant. The expected number of reported cases is expected to decrease by 3.8533 times in Europe compare to Asia while holding other variable in the model constant. Finally, the expected number of reported cases is expected to decrease 8.1037 times in Africa compare to Asia while holding other variable in the model constant.
The table also shows that there is a significant difference between the reported cases in Asia compare to other continent since their P-value is less than 0.05 level of significance.
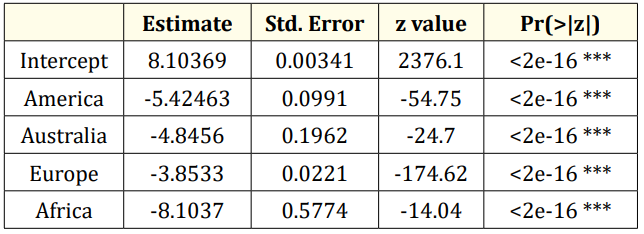
Table 4: Modelling reported cases of coronavirus using Poisson regression model. Signif. codes: 0 ‘***’ 0.001 ‘**’ 0.01 ‘*’ 0.05 ‘.’ 0.1 ‘ ‘ 1.
Table 4 suggests that if a coronavirus case is to be reported, the expected number of reported cases is expected number of reported cases in America will decrease by 5.4246 times compare to Asia while holding other variable in the model constant. Also, the expected number of reported cases is expected to decrease by 4.8456 times in Australia compare to Asia while holding other variable in the model constant. The expected number of reported cases is expected to decrease by 3.8533 times in Europe compare to Asia while holding other variable in the model constant. Finally, the expected number of reported cases is expected to decrease 8.1037 times in Africa compare to Asia while holding other variable in the model constant.
The table also shows that there is a significant difference between the reported cases in Asia compare to other continent since their P-value is less than 0.05 level of significance.

Table 5: Model comparison between models for reported cases.
Table 5 shows the model comparison between Zero Truncated Poisson Model (ZIPM), Negative Binomial regression model and Poisson regression model. The model with the lowest AIC and highest log-likelihood is chosen to be the best model. Negative Binomial regression model is the best model among the selected model since it has the lowest AIC and highest log-likelihood model.
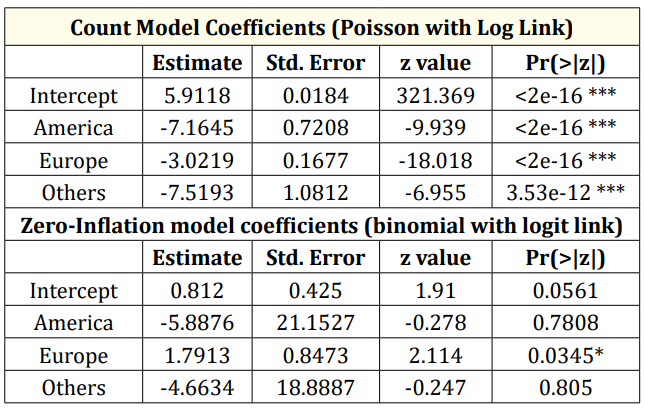
Table 6: Modelling reported cases of death from coronavirus using zero inflated Poisson (ZIP) model. Signif. codes: 0 ‘***’ 0.001 ‘**’ 0.01 ‘*’ 0.05 ‘.’ 0.1 ‘ ‘ 1.
Table 6 shows the fitted model for the reported cases of death and the zero cases using ZIP model. The table suggests that if an infected person from coronavirus is reported dead, the expected number of death reported cases is expected to decrease in America by 7.1645 times compare to Asia while holding other variable in the model constant. Also, the expected number of reported cases of death is expected to decrease by 3.0219 times in Europe compare to Asia while holding other variable in the model constant. The expected number of reported cases of death is expected to decrease by 7.5193 times in other continents (Australia and Africa) compare to Asia while holding other variable in the model constant. The table shows that there is a significant difference between the reported cases in Asia compare to other continent since their P-value is less than 0.05 level of significance.
The table also shows that there is a significance difference in none reported death cases in Asia and Europe since the p-value (0.0345) is less than 0.05 level of significance. This suggest that there is exp (1.7913) chance of no reported cases of death from coronavirus in Europe compare to Asia.
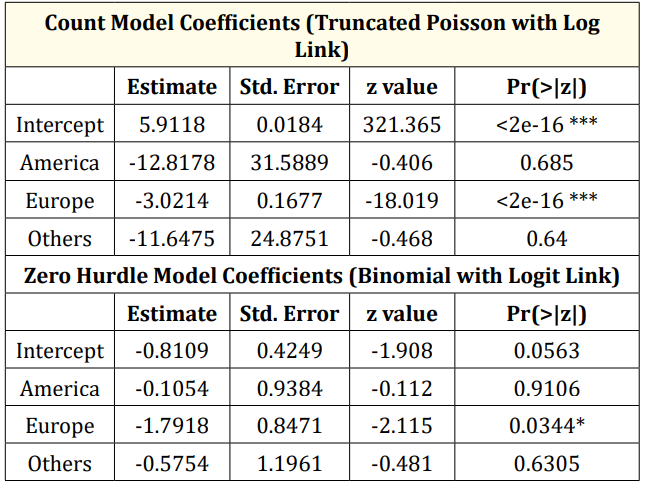
Table 7: Modelling reported cases of death from coronavirus using Hurdle model. Signif. codes: 0 ‘***’ 0.001 ‘**’ 0.01 ‘*’ 0.05 ‘.’ 0.1 ‘ ‘ 1.
Table 7 shows the fitted model for the reported cases of death and the zero cases using Hurdle model. The table suggests that if an infected person from coronavirus is reported dead, the expected number of death reported cases is expected to decrease in America by 12.8178 times compare to Asia while holding other variable in the model constant. Also, the expected number of reported cases of death is expected to decrease by 3.0214 times in Europe compare to Asia while holding other variable in the model constant. The expected number of reported cases of death is expected to decrease by 11.6475 times in other continents (Australia and Africa) compare to Asia while holding other variable in the model constant. The table shows that there is a significant difference between the reported cases in Asia compare to other continent since their Pvalue is less than 0.05 level of significance.
The table also shows that there is a significance difference in none reported death cases in Asia and Europe since the p-value (0.0345) is less than 0.05 level of significance. This suggest that there is exp (-1.7918) chance of no reported cases of death from coronavirus in Europe compare to Asia.

Table 8: Model comparison for reported death.
Table 8 shows the model comparison between ZIPM and hurdle model. The model with the lower AIC and higher log-likelihood is chosen to be the better model. Hurdle model is the better model since it has the lower AIC and higher log-likelihood model.
Descriptive statistics, correlation and count methodologies such as Poisson and Negative binomial models were used in analyzing data generated till the 7th of March 2020. In this study, the variables considered were Meteorological variables such as precipitation, relative humidity, and average temperature of the 94 countries where at least a case of COVID-19 was established as at 7th of March 2020.
Table 9 below showed the correlation between confirmed cases and weather parameters such as average precipitation, relative humidity and temperature.

Table 9: Correlation between confirmed cases and selected weather parameters.
In statistics, relationship between variables are of importance to policy makers in other to identify possible association for planning and decision making. the correlation coefficient r measures the strength and direction of this relationship. In this study, the variables considered were Meteorological variables such as precipitation, relative humidity, and average temperature of the 94 countries where at least a case of COVID-19 was established as at 7th of March 2020. The value of r is always between +1 and –1. Table 1 contained the correlation coefficients which showed the strength and direction of the relationship between the weather parameters and confirmed cases counts due to COVID-19. This showed that no relationship existed between the meteorological variables and the confirmed cases counts due to COVID-19.

Figure 2: Average distribution of temperature across 94 countries with at least a case as at 7th March 2020.

Figure 3: Average distribution of precipitation across 94 countries with at least a case as at 7th March 2020.

Figure 4: Average distribution of Relative Humidity across 94 Countries with at least a case as at 7th March 2020.
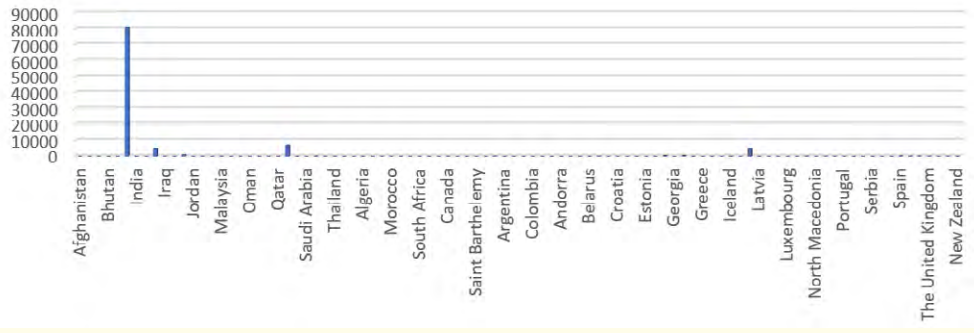
Figure 5: Distribution of Confirmed Cases across 94 Countries with at least a case as at 7th March 2020.
Considering figure 2-4, it is clear that none of the weather parameter exhibit the pattern observed in figure 5 which is the count of confirmed cases as at 7th of March 2020. It is believed that this might increase soon among countries where citizens are interrelated within and without. It is also expected that major destinations in the world might also experience increase in spread as a result of heavy migration, transit and business.
Figure 6 showed the active and closed cases of COVID-19, with infected patients in mild condition being 95% and 5% of the infected being in serious/critical condition under the active cases as at today 1st of April 2020 while 81% (Recovered/discharged) and 19% (Deaths) were observed under the closed cases which was 229,344 in total as at 1st of April 2020 (Source: https://www.worldometers.info/coronavirus/).

Figure 6: Chart showing the Active and closed cases of COVID-19 Pandemic.
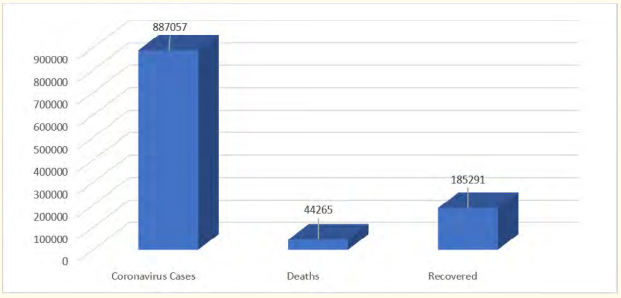
Figure 7: Overview of COVID-19 Pandemic as at 1st of April 2020, 17:00 GMT.
Further computation from the figure 6 revealed that 21% of the total count of confirmed cases have either recovered or discharged from COVID-19 while 5% of the confirmed cases have been lost to the virus.
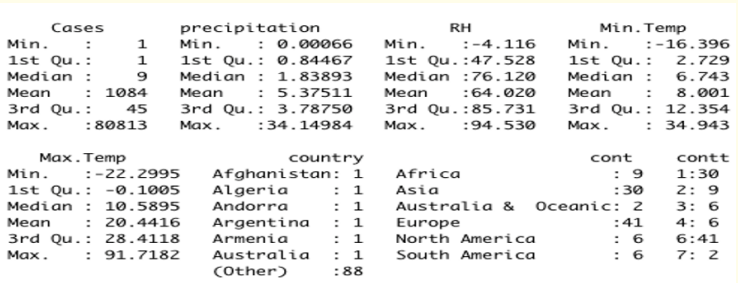
Figure 8: Descriptive Statistics of Confirmed Cases of COVID-19 and Meteorological Variables.
As at March 7th 2020, 94 countries of the world have recorded at least one case of COVID-19. Hence, there were 94 valid observations and their count distributions seem quite reasonable with Europe taking the lead with 41 countries, followed by Asia with 30 countries, Africa with 9 countries, North and South America with 6 countries each and finally, Australia with 2 countries. The unconditional mean and variance of the confirmed cases were extremely different. Our model assumes that these values, conditioned on weather parameters, will be equal (or at least roughly so). Poisson regression was used for modeling the relationship because it has a number of extensions useful for count models. The overdispersion tests carried out suggested the use of a Negative binomial regression since it is primarily used for over-dispersed count data, that is when the conditional variance exceeds the conditional mean like the case, we have in the COVID-19 data. Count outcome variables are sometimes log-transformed and analyzed using OLS regression. Many issues arise with this approach, including loss of data due to undefined values generated by taking the log of zero (which is undefined) and biased estimates. Hence, OLS was not found suitable for this analysis.
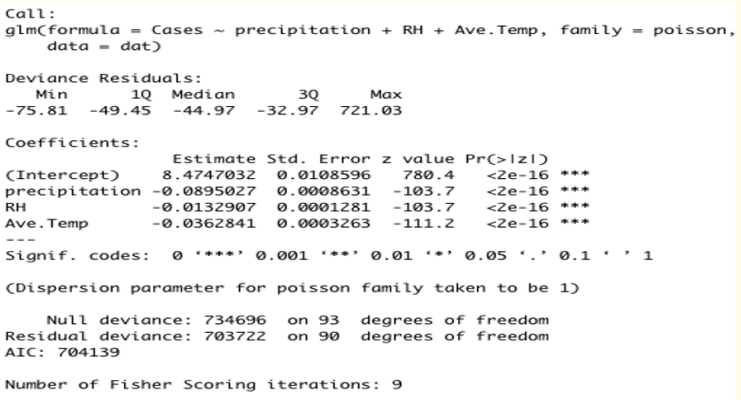
Figure 9: Estimates of the Poisson Regression Model with Meteorological Variables as Predictors.
Considering the p-values in the last column of figure 9, which are less than 0.05. This gave an impression that the impact of the meteorological variables on the confirmed cases of COVID-19 was significant. Hence, the meteorological variables considered have impact on the count of confirmed cases due to COVID-19 outbreak.
Cameron and Trivedi (2009) recommended using robust standard errors for the parameter estimates to control for mild violation of the distribution assumption that the variance equals the mean. We obtain the robust standard errors and calculated the pvalues accordingly. Together with the p-values, we also calculated the 95% confidence interval using the parameter estimates and their robust standard errors as presented in figure 10.

Figure 10: Robust Estimates, Standard Error and Confidence Intervals of the Models in Table 1.
Looking at the outputs in figure 8-10 more closely, Deviance residuals are approximately normally distributed if the model is specified correctly, but in this study, it shows a bit of skewness since median is not quite zero (Median = -44.97). The Poisson regression coefficients for each of the meteorological variables along with the standard errors, z-scores, p-values and 95% confidence intervals for the coefficients. The coefficient for precipitation is -0.09. This means that the expected log count for a one-unit decrease in precipitation is 0.09, 0.01 and 0.04 for Relative humidity and Average Temperature, respectively.
The residual deviance is the difference between the deviance of the current model and the maximum deviance of the ideal model where the predicted values are identical to the observed. The analysis performed revealed residual differences that are small, hence, the goodness of fit tests was not significant for Poisson and negative binomial regression models, indicating that the model does not fits the COVID-19 data appropriately even though the weather parameters were all significant. We conclude that the models do not fit reasonably well because the goodness-of-fit chi-squared test is statistically significant which indicate that the data do not fit the models well [2-4].
From the study, the followings were observed:
Copyright: © 2021 Oyamakin S Oluwafemi., et al. This is an open-access article distributed under the terms of the Creative Commons Attribution License, which permits unrestricted use, distribution, and reproduction in any medium, provided the original author and source are credited.
ff
© 2024 Acta Scientific, All rights reserved.