Mohamed Hamdy Elghotmy*
Anaesthesia, Intensive Care and Pain Management Department, Mistry of Health, Menoufia, Egypt a
*Corresponding Author: Mohamed Hamdy Elghotmy, Anaesthesia, Intensive Care and Pain Management Department, Mistry of Health, Menoufia, Egypt.
Received: October 09, 2019; Published: October 29, 2019
Citation: Mohamed Hamdy Elghotmy. “Study of 25-hydroxy Vitamin D Level in Full-Term Neonate”. Acta Scientific Paediatrics 2.11 (2019):59-64.
Objective: To measure vitamin D level in healthy full-term neonate.
Background: In infants with deficiency of vitamin D, there is an association with small size, impaired growth and skeletal problems.
Patients and Methods: A prospective case control study of 85 neonates and their mothers was conducted at Neonatal Intensive Care Units (NICUs) of the Pediatric Department at Benha Teaching Hospital during the period from October 2017 till April 2019. Full detailed history, examination and laboratory investigations including serum 25-hydroxyvitamin D (25OHD) were done.
Results: There was a significant difference between vitamin D deficient infants and normal infants regarding weight, sex, their mother's weight, mother's educational level and mothers' sun exposure, mother's fish consumption per week. While, there was no significant difference between vitamin D deficient infants and normal infants regarding age, birth order, mother age, mode of delivery and season of delivery, consumption of milk, egg and cheese per week by their mothers. Also, vitamin D shows significant positive correlation with infant's weight and their gestational age.
Conclusion: Vitamin D shows positive significantly correlation with infant's weight. Also, vitamin D shows negative significant correlation with mothers age. In contrast, vitamin D shows n correlation with infants age, infants birth order, and mother weight.
Keywords: Full-Term Neonate; Healthy; Measure; Vitamin D Deficiency
Vitamin D is a group of fat-soluble prohormones [1]. The various forms of Vitamin D are sisterhoods; i.e., broken-open steroids. The structural difference between vitamin D2 and vitamin D3 is in their side chains. the side chain of D2 contains a double bond between carbons 22 and 23 and a methyl group on carbon 24. Vitamin D plays a critical important role in the development, growth, and mineralization of the skeleton during its formative years, and performs an equally essential role in maintaining a healthy mineralization skeleton for adults of all ages. Vitamin D is also essential for intestinal calcium absorption and plays a central role in maintaining calcium homeostasis and skeletal integrity [2].
Vitamin D is metabolized by successive hydroxylation to 25-hydroxyvitamin D and then, to 1,25 dihydroxy vitamin D, the most potent known metabolite of the vitamin D. The formations of 25hydroxylatevitamin D and 1,25Dihydroxyvitamin D are catalyzed by CYP24A1. During pregnancy, the concentration of 25-hydroxyvitamin D in maternal serum increases in parallel with the increased need to absorb dietary calcium. 1,25-Dihydroxyvitamin D is produced in the feto-placental unit as well as in the placenta suggesting that the placenta may be a target for vitamin D action [3].
Maternal and neonatal vitamin D status influences newborn size. Neonates to mothers with severe vitamin D deficiency had lower birth length and birth weight than infants born to mothers with normal levels of vitamin D. The head circumference was smaller in vitamin D deficiency newborns. Vitamin D3 supplementation with 40 μg per day from age 2 weeks to 3 months, maintained 25-hydroxyvitamin D above 80 nmol/L in all infants [4]. Hypovitaminosis D is a candidate risk modifying factor for a diverse range of disorders apart from rickets and osteoporosis. Based on epidemiology, and on in vitro fertilization and animal experiments, vitamin D has been linked to multiple sclerosis, certain cancers (prostate, breast and colorectal), insulin dependent diabetes mellitus and schizophrenia. McGrath hypothesized that low pre- and perinatal vitamin D levels imprint on the functional characteristics of various tissues throughout the body, leaving the affected individual at increased risk of developing a range of adult-onset disorders [5].
Human milk reflects the vitamin D status of the mother and often contains inadequate levels of 25-hydroxyvitamin D for infant nutrition. The Committee on Nutrition of the American Academy of Pediatrics recommends 400 IU of vitamin D supplementation of all infant's state that 10 μg per day (400 IU per day) of vitamin D to all pregnant mothers may be required for optimal health in the mother and child [6]. In infants with deficiency of vitamin D, there is an association with small size, impaired growth and skeletal problems. The annual incidence of vitamin D-deficiency rickets in developed countries ranges between 2.9 and 7.5 cases per 100,000 children. Vitamin D (200-400 IU) per day prevents rickets at the typical calcium intakes [7]. Therefore, the aim of this study was to measure 25-hydroxy Vitamin D level in healthy full-term neonate.
A prospective case control study of 85 neonates and their mothers were conducted at Neonatal Intensive Care Units (NICUs) of the Pediatric Departments at Benha Teaching Hospital and during the period from October 2017 till April 2019.
Careful history taking regarding
The DRG 25-OH Vitamin D total ELISA Kit is a solid phase enzyme-linked immunosorbent assay (ELISA, Life Technologies Corporation, USA). In the first step, samples must be pretreated in separate vials with denaturation buffer to extract the analyte, since most circulating 25-OH VitD is bound to VDBP in vivo. After neutralization, biotinylated 25-OH Vitamin D and peroxidase-labeled streptavidin are added. Endogenous 25-OH Vitamin D of a patient sample competes with a 25-OH Vitamin-D3-biotin conjugate for binding to the VDBG that is immobilized on the plate. Binding of 25-OH Vitamin D-biotin is detected by peroxidase-labeled streptavidin.
The desired number of microtiter wells was secured in the frame holder, 200 ul of the mixed solution of each standard, control and sample with new disposable tips was transferred into the appropriate wells, wells were sealed carefully and incubated for 60 minutes at 37°C, the wells were rinsed 4 times with diluted wash solution 300 uL per well. 200 uL of substrate solution was added to each well, the enzymatic reaction was stopped by adding 100 UL of stop solution to each well and the absorbance (OD) of each well was measured at 450 ± 10 nm with a microtiter plate reader.
All studied patients were divided in two groups
Results analyzed and tabulated using MICROSOFT EXCEL 2016 and SPSS v. 21. (SPSS Inc., Chicago, IL, USA). Percentage (%), mean and SD. Analytical: includes: Chi-Squared (χ2), student, independent and paired t test, and Fisher exact test. A value of P < 0.05 was indicated statistically significant.
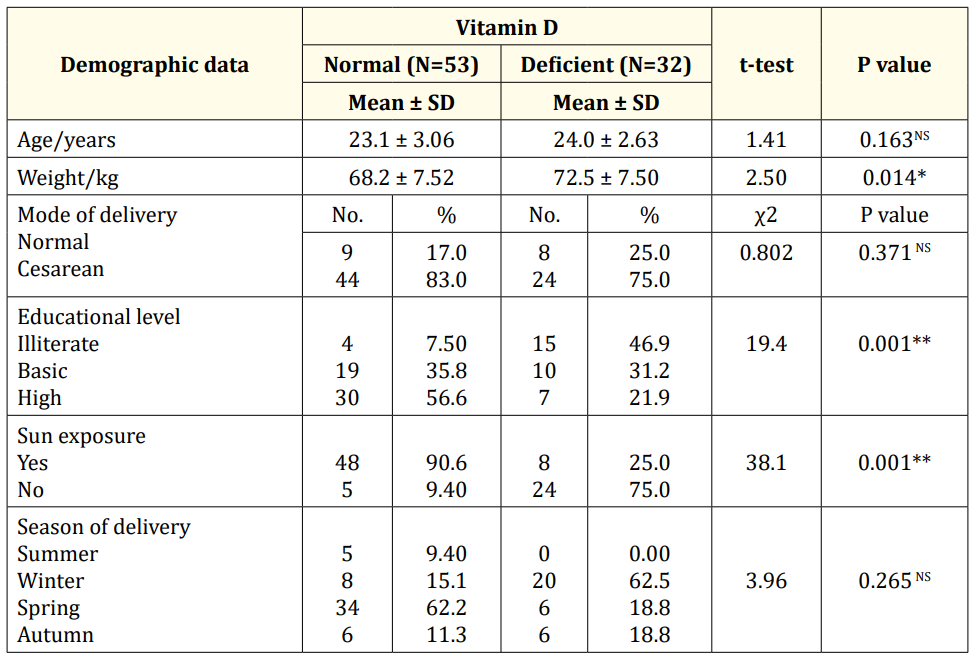
There was a significant difference between vitamin D deficient infants and normal infants regarding weight. Vitamin D deficient infants had lower birth weight than normal infants (3.33 vs 3.64).
Also, there was highly significant difference between vitamin D deficient infants and normal infants regarding sex. While, there was no significant difference regarding age and birth order (Table 1).

Table 1: Comparison between vitamin D deficient infants and normal infants regarding their demographic data (N=85): SD: Stander Deviation; t-Test: Significant t Test; χ2: Chi-Square; #: Mann Whitney Test; *: Significant Differences; **: Highly Significant Differences; NS: Non-Significant Differences.
Additionally, there was significant difference between vitamin D deficient infants and normal infants regarding their mother's weight. Also, mother's educational level and sun exposure were highly significant differences. While, there was no significant difference between vitamin D deficient infants and normal infants regarding mother age, mode of delivery and season of delivery (Table 2).
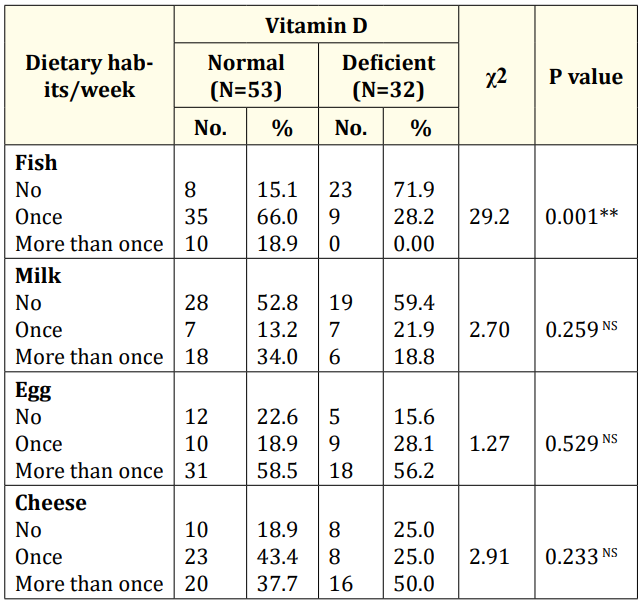
Results showed that there was a highly significant difference between vitamin D deficient and normal infants regarding their mother's fish consumption per week. Above two thirty of vitamin D deficient infants' mothers don’t eat fish once weekly. Versus, above two thirty of normal infants' mothers eat fish once per week. While, there was a statistical no significant difference consumption of milk, egg and cheese/week by their mothers (Table 3).
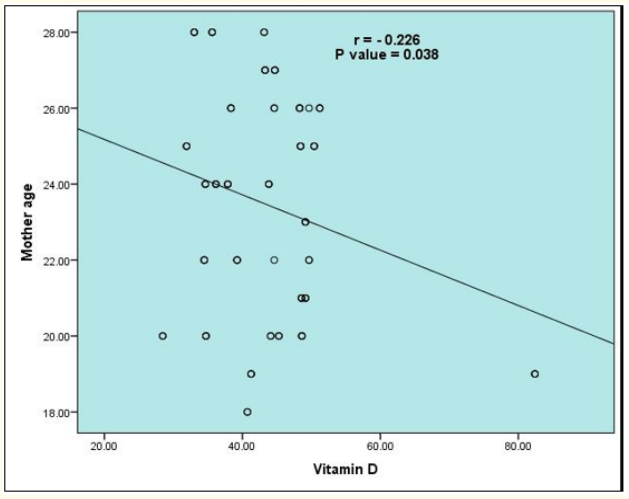
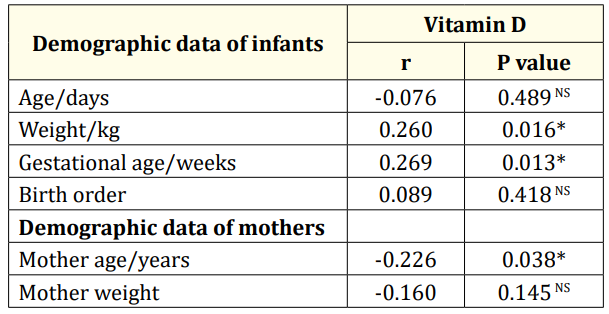
Also, vitamin D shows positive significantly correlation with infant's weight. Also, vitamin D shows negative significant correlation with mothers age. In contrast, vitamin D shows n correlation with infants age, infants birth order, and mother weight (Table 4).

Figure 1: Correlation between vitamin D and gestational age of studied infants.

Table 2: Comparison study between vitamin D deficient infants and normal infants regarding demographic data of their mothers (N=85). SD: Stander Deviation; t-test: Significant t Test; χ2: Chi-Square; *: Significant Differences; **: Highly Significant Differences; NS: Non-Significant Differences.

Figure 2: Correlation between vitamin D and mother age of studied infants.

Table 3: Comparison study between vitamin D deficient infants and normal infants regarding dietary habits/week of their mothers (N=85). χ2: Chi-Square; *: Significant Differences; **: Highly Significant Differences; NS: Non-Significant Differences.

Table 4: The relationship between vitamin D and demographic data of infants and their mothers (N=85). r: Correlation Coefficient; *: Significant Differences; **: Highly Significant Differences; NS: Non-Significant Differences.
The current study showed that there was a significant difference between vitamin D deficient infants and normal infants regarding weight and sex. Vitamin D deficient infants had lower birth weight than normal infants (3.33 vs 3.64). while, 87.5% of vitamin D deficient infants were males. On the other hand, there was no significant difference between vitamin D deficient infants and normal infants regarding age and birth order. These findings are consistent with Ercan., et al. [8] who found that low neonatal birth weight was recorded in Vitamin D deficient infants group than healthy infants group. Furthermore, Levin., et al. [9] found that 60% of vitamin D deficient neonates were males and 40% were female. Another study conducted by McGill., et al. [10] reported that vitamin D deficiency is associated with a greater risk of these pathological conditions. Furthermore, an increased body fat and obesity infants were associated with low circulating 25(OH)D level [11]. Similar to Khalessi., et al. [12] found a significant difference in birth weight of babies of mothers who had higher vitamin D levels. Vitamin D has a key role in fetal growth by its interaction with parathyroid hormone and Ca2+ homeostasis. Moreovere, Marwaha., et al. [13] and Sachan., et al. [14] found that neonates age had no association with mean vitamin D levels (p-value 0.239). In follow-up assessments by Maghbooli., et al. [15] they found that there was no significant effect of maternal vitamin D deficiency on weight gain during pregnancy. This difference may be due to larger number of cases and different conditions or method labor they had used and using different doses of vitamin D in their study.
In the current study, there was a statistically significant difference between vitamin D deficient infants and normal infants regarding their mother's weight, educational level, and mothers' sun exposure. Vitamin D deficient infants' mothers had higher body weight than normal infants (72.5 vs 68.2 kg). 46.9% of Vitamin D deficiency infants' mothers were illiterate. Also, mothers of 75% of infants with vitamin D deficiency not exposed to sun while mothers of 90.6% of normal infants were exposed. On the other hand, there was no significant difference regarding mother age, mode of delivery, and season of delivery. In concordance with our results, many authors found that compared with lean women, pretravel obese women had lower adjusted mean serum 25(OH) D concentrations and a higher prevalence of vitamin D deficiency. Obesity is a notable risk factor for vitamin D deficiency that may be related to a sequestering of vitamin D3 in adipose tissue [16]. Vandevijvere., et al. [17] confirmed a high prevalence of obesity, implicating calcidiol deficiency in overweight and obese people. Choi., et al. [18] who reported that maternal characteristics, e.g. Age, type of current pregnancy, number of concurrent pregnancies, mode of parity, parity seasons were not significantly different among the studied groups of pregnant women as stratified by vitamin D status. Gupta., et al. [19] found that women with cesarean deliveries had lower mean vitamin D compared with those having vaginal deliveries, though the difference was not significant in his study. There was no association between low vitamin D level and mode of delivery (pvalue 0.326). Vitamin D is obtained from exposure to sunlight, diet, and dietary supplements. It is difficult to obtain the recommended amount by di., et al.one because there are few foods that naturally contain or are fortified with vitamin D [20].
In our study, there was a highly statistical significant difference between vitamin D deficient infants and normal infants regarding their mother's fish consumption per week. Above two thirty of vitamin D deficient and normal infants' mothers don’t eat fish once weekly and eat fish once per week respectively. While, no significant differences were detected regarding consumption of milk, egg and cheese per week. Our results confirmed by El Rifai., et al. [20] who found that more than 50% of women included in their study were consuming fish infrequently, and more than 72% were not consuming eggs regularly. A cross-sectional study including 50 women in labor with a singleton term pregnancy in Pakistan measured vitamin D status in maternal blood before delivery and cord blood at delivery. They stated that vitamin D levels were significantly affected by sunlight exposure. Vitamin D is obtained either through photosynthesis in the skin with exposure to ultraviolet B radiation or through dietary sources [17]. Also, Hochberg., et al. [21] reported that factors that reduce the ability of the skin to synthesize vitamin D include ultraviolet light from the sun being blocked by air pollution, clothes, tall buildings, indoor dwelling, and sunscreens.
In our country Egypt is an Islamic country, where most females wear the traditional clothes that cover the whole body apart from face and hands. Clothing habits have accounted for the high prevalence of vitamin D deficiency among our study participants.
In the current study, it was found that vitamin D shows significant positive correlation with infant's weight, and negative correlation with mothers age. On the other hand, vitamin D wasn't correlated with infants age, birth order, mother weight. This comes in agreement with Dunlop., et al. [22] who found that vitamin D level was significantly positive correlated with gestational age at delivery. Also, Marya., et al. [23] found no effect of maternal vitamin D supplementation on weight gain, Furthermore, Leffelaar., et al. [24] assessed 3730 women at less than 12 weeks gestation and found an association between vitamin D and infant's weight. Brooke., et al. [25] observed less weight gain in the pregnancies without supplementation compared with the supplementation group. while other studies have found no relationship between vitamin D levels and birth weight [26,27]
Vitamin D shows positive significantly correlation with infant's weight. Also, vitamin D shows negative significant correlation with mothers age. In contrast, vitamin D shows n correlation with infants age, infants birth order, and mother weight.
Copyright: © 2019 Mohamed Hamdy Elghotmy. This is an open-access article distributed under the terms of the Creative Commons Attribution License, which permits unrestricted use, distribution, and reproduction in any medium, provided the original author and source are credited.
ff
© 2024 Acta Scientific, All rights reserved.