Heather H Betz1*, Kelly R Laurson2 and Joey C Eisenmann3
1Chair and Associate Professor, Department of Kinesiology, Albion College, USA 2Professor, School of Kinesiology and Health, Illinois State University 3Head of Sports Science/Volt Athletics; Visiting Professor, Leeds Beckett University School of Sport
*Corresponding Author: Heather H Betz, Chair and Associate Professor, Department of Kinesiology, Albion College, USA.
Received: July 16, 2019; Published: September 10, 2019
Citation: Heather H Betz., et al. “Variation in Moderate-to-Vigorous Physical Activity by Weight Status among U.S. Children and Adolescents: The “Fat but Active” Phenotype”. Acta Scientific Paediatrics 2.10 (2019):20-26.
Background: The purpose of this paper was to investigate the prevalence of distinct combinations of physical activity (PA) by weight status, particularly the idea of the ‘fat but active’ phenotype and the association of PA with overweight/obesity.
Methods: Data from 3299 (1665 boys) youth aged 6 to 18 years observed in the 2003 - 2004 and 2005 - 2006 NHANES were used.
Results: One-third of the sample was overweight (17.2%) or obese (16.1%) and 62.5% did not meet the recommendation for moderate- to vigorous PA (MVPA) of 60 min/day (56.3 ± 1.8% in boys and 69.1 ± 1.6% in girls). 18.5% of the total sample spent < 15 min/ day in MVPA. Of the 37.5% youth meeting the PA recommendation, 27.5% were normal weight, 5.6% were overweight and 4.3% obese (‘fat but active”). Among normal weight youth, 41.3 ± 1.8% met the MVPA recommendation compared to 32.3 ± 2.8% of overweight and 27.0 ± 2.6% of obese youth. 16% of normal weight youth were classified as least active compared to 24% of overweight and obese. There was a graded, inverse relationship between MVPA and percent overweight and obesity.
Conclusion: This paper provides a unique perspective on the variation in MVPA by weight status in a large nationally representative sample of U.S. youth.
Keywords: Exercise; Guidelines; Obesity
Currently, 17% of youth (ages 2 - 19 years) in the United States (U.S.) are obese [1] and 58% of children ages 6 - 11 years and 92% of 12 - 19 years do not meet the recommended amount of physical activity ( > 60 minutes of moderate-to-vigorous physical activity (MVPA) per day) [2]. In general, there is an assumption that normal weight youth are physically active and obese youth are physically inactive. Overweight and obese youth have been shown to be less active compared to normal weight youth [3], but it has also been shown that a significant percent of overweight or obese children do meet current physical activity recommendations (60 minutes of MVPA) [4]. Indeed, in a sample of 157 youth, we found that 39% of the overfat (based on dual energy x-ray absorptiometry) participants met the physical activity recommendations, whereas 43% of normal fat youth did not meet the recommendation [5]. In addition, it has been shown that there is a fair amount of variability in the relationship between physical activity and overweight [6], indicating that there is considerable variation in physical activity among individuals with similar levels of adiposity.
The primary purpose of this paper was to investigate the prevalence of distinct combinations of MVPA by weight status among U.S. children and adolescents, particularly the idea of the ‘fat but active’ phenotype. Secondarily, we examined the association of physical activity with overweight and obesity in a nationally representative sample of 6 - 18 year old children and adolescents.
Cross-sectional data from the 2003 - 2004 and 2005 - 2006 National Health and Nutrition Examination Survey (NHANES) [7] were used in this analysis. NHANES is a program of cross-sectional studies designed to assess the health and nutritional status of adults and children in the U.S. through a combination of interviews and physical examinations. The survey protocols and procedures were approved by the National Center for Health Statistics ethics review board and all materials were produced in English and Spanish with bilingual staff conducting the surveys and health examinations. NHANES collects data at 15 different geographic locations that are selected randomly annually, allowing for a representative sample of U.S. children and adolescent population. This study was deemed exempt from institutional review board given the publicly available nature of the data and secondary data analysis.
Children and adolescents 6 - 18 years of age with body mass index (BMI) and physical activity data were included in the analyses. Physical activity data were included if participants had a minimum of four days of measurement with a minimum wear time of 10 hours per day. A total of 3299 (1665 males, 1634 females; 12.2% Mexican-American, 4.5% other Hispanic, 61.8% non-Hispanic White, 14.9% non-Hispanic Black, 6.6% other) 6 - 18 year olds met these criteria.
Participants’ weight was measured on a digital scale (Toledo Scale, Columbus, OH) in pounds and converted to kilograms and height was measured on an electronic stadiometer (Seca Ltd, Medical Scales and Measurement Systems, Birmingham, United Kingdom) to the nearest millimeter. BMI (kg/m2) was calculated and BMI percentiles were determined from the Centers for Disease Control and Prevention SAS growth chart computer program (http://www.cdc.gov/growthcharts/computer_programs.htm). BMI was used as a proxy for fatness since BMI is widely used clinically and epidemiologically to categorize weight status in children [8].
Participants aged ≥ 6 years were asked to wear an Actigraphy accelerometer (model 7164, Actigraphy, LLC; Ft. Walton Beach, FL) for the seven consecutive days after their medical examination. The Actigraph is a small (2.0 x 1.6 x 0.6 inches (5.1 x 4.1 x 1.5 cm)), light (1.5 ounces (0.4 kg)) instrument that records integrated vertical acceleration information as an activity count, which provides an objective estimate of the intensity of bodily movement. Participants wore the accelerometer on their right hip on an elastic belt and were asked to remove it only when swimming or bathing. At the end of the seven days, participants returned the accelerometers via express mail. At that time, the data were downloaded, and the accelerometers checked to determine whether the device was still working within the manufacturers’ calibration specifications. The accelerometer recorded counts (vertical acceleration) in one-minute epochs for up to one week. The amount of time participants spent in MVPA was calculated based on count thresholds that correspond to MVPA [9]. These thresholds were devised based on calibration studies examining the relationship between accelerometers and measured energy expenditure. For children and adolescents, age-specific criteria was used for the following thresholds: 4 metabolic equivalents (METS) for moderate activity and 7 METS for vigorous activity to account for a greater energy expenditure in children and adolescents [9]. The accelerometer data was compiled and analyzed using the programs created by the National Cancer Institute (available at http://appliedresearch.cancer. gov/nhanes_pam/).
Descriptive characteristics were calculated for the total sample and by sex. Sex differences were examined by t - tests for continuous variables and chi-square tests for categorical variables. Fatness was categorized into three groups based on age- and sex-specific BMI percentiles that are used widely in clinical, public health and epidemiological practice: normal weight (≥ 5th < 85th percentile), overweight (≥ 85th percentile < 95th percentile), and obese (≥ 95th percentile) and physical activity was categorized into three groups based on the participants’ minutes of MVPA as measured by accelerometer: least active (< 15 minutes MVPA/day), low active (≥ 15 - 59 minutes MVPA/day), and active (≥ 60 minutes MVPA/day). Additionally, besides by the total sample, weight status and physical activity were presented based on several groupings: sex, age (6 -11.9 and 12 -18.9 years), and race/ethnicity (Mexican American, Non - Hispanic White, and Non-Hispanic Black). For the race/ethnicity categorization, participants reporting as “Other Hispanic” or “Other” were excluded due to low unweighted sample sizes, but all five categories of race/ethnicity are present in the other analyses.
Logistic regression was used to model the odds of overweight/ obesity (BMI percentile ≥ 85th) based on MVPA group (least, low, and active). The logistic model was completed separately by sex, controlling for age and race/ethnicity. Then, controlling for age, sex, and race/ethnicity, another logistic model was used including both boys and girls simultaneously. Finally, we created 9 groups based on 15 - minute segments of MVPA, ranging from 0 - 14.9 minutes to ≥ 120 minutes, and calculated the prevalence of normal weight, overweight, and obesity by group. Statistical analyses were performed using SAS Version 9.2 (SAS Institute Inc, Cary, NC), with the level of significance set at p < 0.05. The complex sample design, including sample weights, clusters, and stratification, was accounted for in all analyses.
Descriptive characteristics of the sample are shown in Table 1. Overall, one-third of the sample was overweight (17.2%) or obese (16.1%) with no differences between sexes. Boys were more active than girls (66.0 ± 2.1 v. 46.3 ± 1.4 min/d, respectively). The average ( ± standard error) amount of time spent in moderate physical activity and vigorous physical activity in the total sample was 47.8 ± 1.0 and 8.6 ± 0.5 min/d, respectively, and 62.5% did not meet the recommendation for MVPA of 60 min/d (56.3 ± 1.8% in boys and 69.1 ± 1.6% in girls). In terms of the sex difference, the difference in those meeting the recommendation (about 13% in favor of boys) was displaced to the least active (0 - 15 min/d) group, as those getting 15 - 59 min/d was similar between the sexes. Furthermore, 18.5% of the total sample spent less than 15 min/d in MVPA (Table 2) with more girls than boys (10.3% boys, 26.2% girls) in this category. Less than one - percent of 6 - 11.9 year old boys (0.9%) and girls (0.5%) were in the least active group.
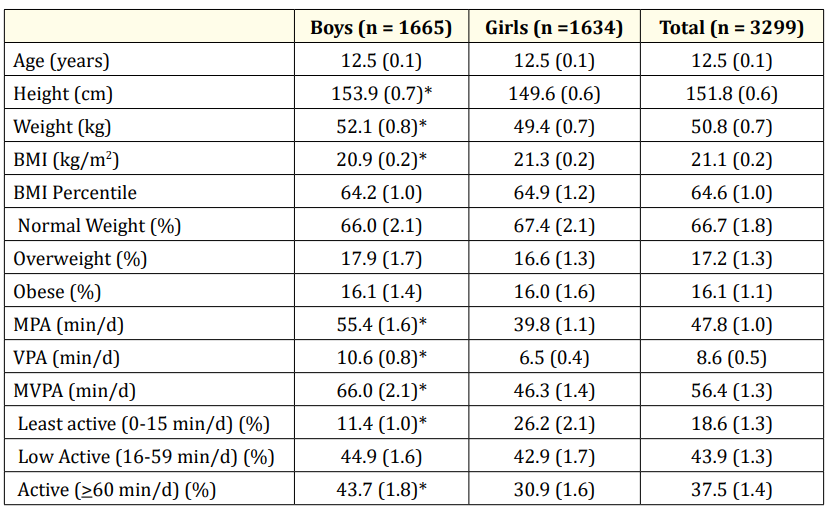
Table 1: Descriptive characteristics of the total sample and by sex. Values are mean (SE) or percentage (SE of percentage) BMI, body mass index; MPA, moderate-intensity physical activity; VPA, vigorous-intensity physical activity. * Indicates statistically significant difference between boys and girls (p < 0.05).
Table 2 provides the percent of participants cross-tabulated by weight status and physical activity group. Each row (e.g. Boys, 6 - 11.9 year old boys, etc.) sums to 100%. Of the 37.5% of U.S. youth meeting the physical activity recommendation, most were normal weight (27.5%) followed by the overweight (5.6%) and obese, with 4.3% of the total sample in the ‘fat but active” category. There also appeared to be some differences by sex, age, and ethnicity. For example, 5.8% of normal weight boys were least active vs. 15.9% of normal weight girls. In this same category, 12 - 18 year olds had a higher percentage than 6 - 11 year olds (e.g., 10.3% v. 0.1 in boys and 28.4% v. 0.1% in girls). This also occurred within the fat-active group. Furthermore, there were more Mexican American boys than White or Black boys categorized as fat - active. Very few (0.7%) 12 - 18year old girls were classified as fat-active. More than 50% of 6 - 11.9 year old boys and girls were normal weight and active. In boys, the predominant group shifted from normal weight/active to normal weight/low active from the younger to older age group. There were more 6 - 11 year old boys and girls (9.2% and 5.9%, respectively) than 12 - 18 year old’s (2.8% and 0.7%) who were fat-active.
Table 3 shows the prevalence of physical activity within a weight status group as opposed to the total sample per Table 2. Among normal weight youth, 41.3 ± 1.8% met the physical activity recommendation compared to 32.3 ± 2.8% of overweight and 27.0 ± 2.6% of obese youth. In boys, a similar percent of overweight and obese boys met physical activity recommendations (37.2% and 35%, respectively) whereas in girls there was an inverse graded percentage from normal weight to obese. There were similar percentages of normal weight, overweight, and obese in the low active group. On the other end of the spectrum, 16% of normal weight youth were classified as least active compared to 23 - 24% of overweight and obese. These values vary in boys and girls with only 9% of normal weight boys being least active whereas 32% of overweight and obese girls were least active.
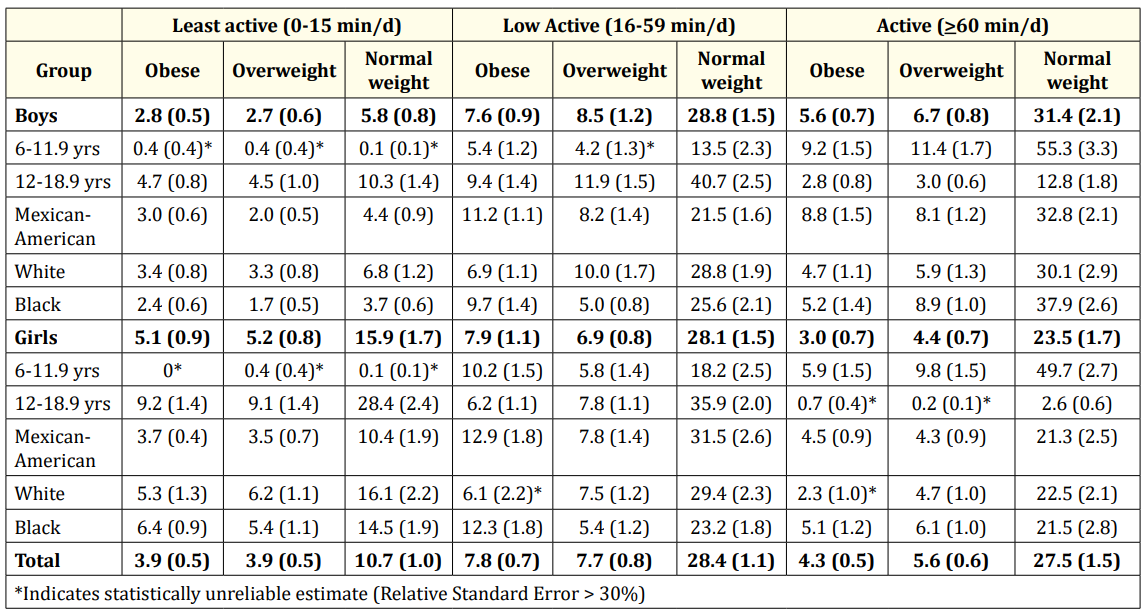
Table 2. Cross-tabulation of moderate-to-vigorous intensity physical activity and weight status categories by sex, age, and race/ethnicity. Values are percentage (SE of percentage). Each row (e.g., Boys, 6-11.9 yr old boys, etc.) sums to 100%.
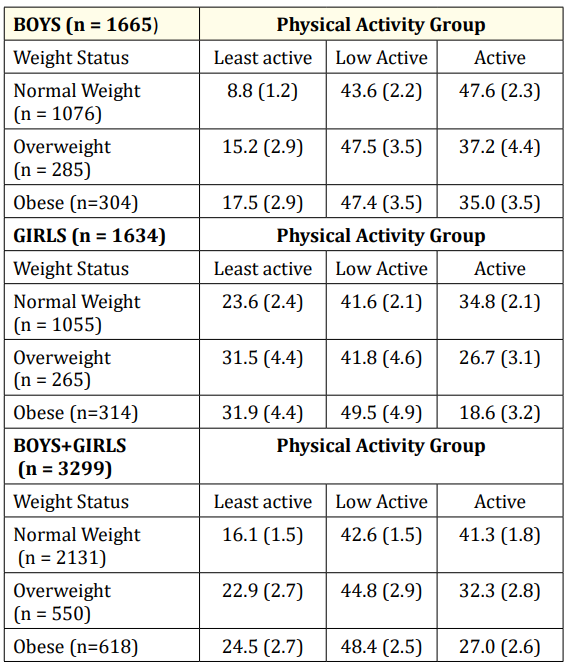
Table 3: Cross-tabulation of moderate-to-vigorous intensity physical activity and weight status categories by sex. Values are percentage (SE of percentage). Each row sums to 100%.
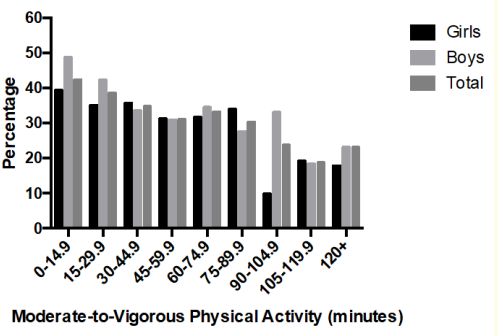
Figure 1: Percent of overweight and obese youth by 15-minute segments of moderate-to-vigorous physical activity.
We further broke down the MVPA categories into 15 minutes segments and examined the percent overweight and obese in each category (Figure 1). In general, there was a graded, inverse relationship between MVPA and percent overweight and obesity. In the least active group (0 - 15 min/d), 42.4% (48.8% boys and 39.4% girls) were overweight or obese. At the other end of the extreme (≥ 120 min/d), 23.1% (25.3% boys and 17.9% of girls) were overweight or obese. Overall, 10.0 ± 0.6% engaged in ≥ 120 min/day of MVPA.
Logistic regression models predicting combined overweight and obesity (BMI ≥ 85th age - and sex - specific percentile) from the three activity groups (active, low active, least active) indicated that in the total sample, low active and least active youth were 1.9 (95%CI 1.4 - 2.6) and 3.0 (95% CI, 2.0 - 4.7), respectively, times more likely to be overweight or obese compared to active youth (those meeting 60 min/d of MVPA). The odds in boys were 1.7 (1.1 - 2.5) and 3.0 (1.6 - 5.7), respectively and in girls 2.3 (1.4 - 3.7) and 3.5 (1.8 - 6.8), respectively. All odds ratios were statistically significant.
Although previous papers using NHANES have documented the prevalence of overweight and obesity [10] and physical activity [2] separately, this paper provides a unique perspective on the variation in physical activity level by weight status in a large nationally representative sample of U.S. children and adolescents. Although low levels of MVPA were significantly related to overweight and obesity i.e., low active and least active children were 1.9 (95%CI 1.4 - 2.6) and 3.0 (95% CI, 2.0 - 4.7), respectively, times more likely to be overweight or obese compared to active youth], the proportion of obese-active and normal weight-least active youth in the U.S. youth population is noteworthy as are age, sex, and ethnic differences.
As previously shown in NHANES, about one-third of U.S. youth are overweight or obese [1] and 62% do not meet the physical activity recommendation [2]. The finding that boys are more active than girls and younger children more active than adolescents is well-known [2] and there is no need to elaborate these points in this paper. Of the time spent in MVPA (54 min/d), most was spent in moderate-intensity (4 - 6.9 METs) with only 9 min in vigorousintensity (> 7 METs). Besides the finding that 62.5% did not meet the physical activity recommendation, it is also important to recognize that 18.5% engaged in less than 15 min/d of MVPA. This latter finding suggests a significant amount of sedentary behavior (1.0 - 1.5 METs), which has been shown to be significantly related to several health outcomes [11]. However, one cannot rule out that some of these individuals engaged in a significant amount of lightintensity activity (1.5 - 2.9 METs). Regardless, there is an independent association of MVPA with several chronic disease markers as well [12], and thus youth should be encouraged to meet the physical activity recommendation [13] and reduce sedentary time (or at least break long durations of sedentary behavior) [14].
Again, the novel aspect of this paper was the examination of the prevalence of distinct combinations of physical activity by weight status among U.S. children and adolescents. In particular, we were interested in the idea of the ‘fat but active’ phenotype. In fact, 27% of obese boys and girls met physical activity recommendations (35% boys and 19% girls) (Table 3). Hence, one cannot assume that obese children are inactive (or that normal weight children are active). Overall, slightly more than one-quarter (27.5%) of the sample were normal weight and met physical activity recommendation, while roughly one in ten were either overweight or obese and simultaneously met physical activity recommendation (5.6% overweight-active; 4.3% obese - active). The percentages in specific age and ethnic groups also varied. For example, there were more Mexican American boys (8.8%) than White (4.7%) or Black boys (5.2%) categorized as fat - active. Very few (0.7%) 12 - 18yr old girls were classified as fat - active. Younger boys and girls were also more likely to be normal weight and active. So again, the assumption cannot be made (e.g., clinical impression) that overweight and obese youth are inactive and normal weight youth are active. This perhaps has important implications on health outcomes given the independent association of physical activity with several health outcomes [15].
On the upper end of the physical activity spectrum, 10.0% (13.6% of boys and 6.2% of girls) engaged in ≥ 2 hours of MVPA/ day. Although there is no context as to how this amount of MVPA was achieved, participation in youth sports or training for youth sports is often thought of when considering this amount of MVPA. Although this is possible, it should also not be assumed that children and adolescents who participate in youth sport are getting MVPA that equals the practice or game time, etc. In a study of 6 - 12 year old children, participants achieved 110 ± 25 min of MVPA from participating in youth sport, which contributed 23% of the total time spent in MVPA. Participants engaged in significantly more sedentary activity and significantly less MVPA on a non-sport day compared with the sport day. Of the time spent in sport, the majority (52%) was sedentary or light-intensity activities, with moderate and vigorous physical activity accounting for about 27% and 22%, respectively [16]. Another similar study examined 7 and 14 year olds attending soccer or baseball/softball practices [17]. Overall, 24% of participants met the 60 - minute physical activity recommendation during practice; however, selected age groups and sports showed fewer meeting the recommendation (10% of 11 to 14 year olds and 2% of softball players). Overall, 46% of practice was spent in MVPA, which is similar to that found by Wickel et al. (49%). Finally, it should also be pointed out that even at the upper end of the physical activity spectrum, there were still 23% with a BMI ≥ 85th percentile indicating the multifactorial nature of the obesity phenotype [18].
The graded inverse relationship between MVPA and percent overweight and obesity (Figure 1) and the results of the logistic regression (Table 4) indicate the importance of physical activity as a determinant of overweight and obesity. The odds of overweight/ obesity for those not meeting the physical activity recommendation were 2 to 3 - fold compared to active youth. Although there is a plethora of studies examining the cross-sectional association between physical activity and weight status/adiposity in children and adolescents [19], few have used logistic regression models. We have previously used this approach in the Youth Risk Behavioral Survey [20] and a sample of 10-year-olds from Iowa and Minnesota [21]. The results of the current study are similar to those we found in Midwest 10 year old children who did not meet the pedometer steps per day guidelines [21].
In conclusion, this paper provides a unique perspective on the variation in MVPA by weight status in a large nationally representative sample of U.S. children and adolescents. The proportion of obese-active (> 60 min/day) and normal weight-least active (< 15 min/d) youth in the U.S. youth population is noteworthy and indicates that one should not make the common assumption (s) between weight status and physical activity level. There is a need to increase the proportion meeting physical activity recommendation in all youth, but especially in adolescents, specifically adolescent girls, as it is a key risk factor for overweight and obesity.
Copyright: © 2019 Heather H Betz., et al. This is an open-access article distributed under the terms of the Creative Commons Attribution License, which permits unrestricted use, distribution, and reproduction in any medium, provided the original author and source are credited.


 Open Access by
Acta Scientific is licensed under a Creative Commons Attribution 4.0 International License
Open Access by
Acta Scientific is licensed under a Creative Commons Attribution 4.0 International License
Based on a work at https://actascientific.com
ff
ff
© 2024 Acta Scientific, All rights reserved.