Bodzewan Emmanuel Fonyuy*, Sama Paltiel YETI and Tata Fon Elvis
College of Nursing, Bamenda, Cameroon
*Corresponding Author: Bodzewan Emmanuel Fonyuy, College of Nursing, Bamenda, Cameroon.
Received: May 21, 2019; Published: August 29, 2019
Citation: Bodzewan Emmanuel Fonyuy., et al. “Impact of Community Performance based Financing on the Uptake of Maternal and Child Health Services in Health Facilities in the North West Region of Cameroon”. Acta Scientific Paediatrics 2.9 (2019):70-96.
Introduction: According to the most recent estimate by the WHO Global Health Observatory (2012), Cameroon has the 32nd highest infant mortality rate in the world, decreasing from 63.3/1000 in 2009 to 59.7/1000 in 2011. With the poor trends in maternal and child health indicators, it is obvious that either the strategies in place were not effective or their implementation was problematic. To better achieve the objective, Community Performance Base Financing (CPBF) was introduced to be piloted in the Northwest Region in August 2015.
The main objective of this study is to provide evidence based information to policy makers on how to improve upon the uptake of Maternal and Child Health care;
A total of 200 women of child-bearing age and 72 Community Health Workers (CHWs) from four Health Districts comprised this study. Two sources of data were used for the study, a primary and secondary source. Using the barrier method, for p value less than 5%, result was considered significant, between 5% and 10%, there was a possible difference, greater than 10% no difference. A majority of the respondents (52.78%) indicate that the clients they refer always comply, 30.56% indicate that the clients comply most times, 12.50% indicate that the clients comply sometimes while only 4.17% indicated that the clients rarely comply with referrals. 81.93% of the clients perceive that CHWs’ referral influenced their final decision to utilize the Health facility while 18.07% perceive that CHWs’ referral did not influence their utilization of the Health facility. Notwithstanding, a majority of the CHWs (83%) were not satisfied with their motivation.
CHWs can be seen to contribute significantly to MCH service uptake in the Health facility as they play a significant role of convincing and referring clients for MCH services. Their work can therefore be seen to have an undisputable effect on MCH service uptake as a majority of clients indicated that their final decision to utilize the service was because of CHWs’ referral and many also indicated that had they been referred by a CHW, they would have utilized the service they were eligible for.
The main motivating factor among others for the CHW is financial incentive although a majority of them think that the motivation they are currently getting is not adequate and advocate for better financial motivation.
Keywords: Performance based Financing; Motivation; Community Health Workers; Service Uptake; Utilization; Health Districts
According to the most recent estimate by the WHO Global Health Observatory [1], Cameroon has the 32nd highest infant mortality rate in the world, decreasing from 63.3/1000 in 2009 to 59.7/1000 in 2011. Cameroon is not on tracking for reaching the majority of MDGs, and is faring even poorer than the majority of countries in the region. For example, in order to have achieved MDG 5 by 2015, the under-5 mortality rate would have to be reduced from 136/1000 to 45/1000 in less than three years. It also seems unlikely that MDG 4 (reduction in maternal mortality) was to be close to being achieved, as the maternal mortality rate had to decrease from 600 deaths per 100,000 live births to 170 deaths per 100,000 live births in the next three years. While the incidence of underweight children would also have to decrease by nearly half, from 17% to 9%, by 2015, the situation has actually worsened during the past 5 years [1,2].
Pregnancy and childbirth remain significant risk factors for mortality: one woman dies every 2 hours due to complications of pregnancy or childbirth, and one pregnancy out of 50 is fatal. Cameroon has the 18th highest rate of maternal mortality in the world, ranked just between the Republic of Congo and Angola [2].
The proportion of children completely vaccinated (53.2% of children between 12-23 months in 2011) remains a significant problem, even though 98% of the sampled population of a recent study could identify locations where child vaccinations can be acquired, and that 77% of individuals with dependent children are informed in advance of upcoming vaccination campaigns. According to the same study, 53% of children 12-23 months were fully vaccinated, while only 5% had not received any type of immunization. 42% of children among this age group were partially vaccinated [2].
Currently, 23% of women aged 15-49 years in the union use a contraceptive method, compared to 26% in 2004. After a significant increase in utilization of contraceptive methods between 1998 and 2004, utilization has begun to slight decline over the past decade [2].
In 2011, 85% of pregnant women received at least one antenatal consultation from a qualified provider (against 83% in 2004) [2]. Regional disparities show that coverage of assisted deliveries in the northern regions in 2011 is only half of the level coverage seen in other regions more than 20 years ago (1991).
Close to 40% of women deliver at home or without the assistance of professional health workers, with the percentage increasing to 81.8% among the poorest quintile of the population. Globally, little progress has been made over the years. In 2011 61% of births took place in a health facility, a slight increase from 59% in 2004 [1]. The principal causes of these poor health outcomes are lack of schooling and education, geographical barriers to health facilities, and a lack of qualified staff in rural facilities to provide antenatal care services [2].
With the poor trends in maternal and child health indicators, it is obvious that either the strategies in place were not effective or their implementation was problematic. There was therefore need for change of strategy that will move the country towards ameliorating Maternal and Child health thereby achieving MDG 4 and 5.
Performance Based Financing (PBF) seemed a good option to be able to stimulate change in the health system. Experience from countries like Afghanistan and Rwanda with poor health systems which were improved upon by PBF provided some evidence for the project implementation in Cameroon. PBF schemes have also shown to increase skilled delivery in India, increased the outputs of non-governmental organizations in health in Haiti, and increased immunization coverage (Eichler., et al. 2007). PBF project is designed to incentivize various institutions in the health system based on measurable pre-defined performance results. Incentives are made mostly in the form of cash to institutions performing in various areas considered as priorities such as MCH and HIV. Performance aspects such as service availability, health personnel attitude and respect of norms and standards are targeted issues, expected to improve upon the supply side which can improve upon the demand for health services.
The Cameroon government then embarked on implementing the Performance Based Financing project in four of the ten regions within the country in 2012. This project entails payment of subsidies to various health institutions upon verification of their quantity and quality results at the health facility and community levels. The intention of the government was to improve upon the quantity and quality of health care, particularly Maternal and Child health care services.
According to the baseline study on the PBF project carried out by Institute de Formation et de Recherche Démographiques (IFORD) and the World Bank, Knowledge and use of community health workers varies between health facility and Regions within the Country. It was observed that, 46.32% of respondents at the primary care level knew of Community Health Workers (CHWs) in their community as opposed to just 19.51% of respondents at the hospital level. 31.68% of respondents in the Southwest region were aware of CHWs in their community as opposed to 51.14% of respondents in the Northwest region (Cameroon PBF Health Facility in-depth baseline Survey July 2013). There is therefore need to increase the use of Community Health Workers to ensure a maximum representation of the health facilities in their communities with the aim of improving target indicators.
What are the effects of Community Performance Based financing on the uptake of maternal and Child Health Services?
The main objective of this study is to provide evidence based information to policy makers on how to improve upon the uptake of Maternal and Child Health care.
Women of childbearing age are more likely to accept and utilize the MCH packages when referred by a CHW than when they are not referred.
The researcher used the descriptive cross sectional study design in which primary data was collected from women of childbearing age relative to their experiences during pregnancy, delivery and follow-up of care thereafter. Primary data was also collected from CHWs to obtain data relating to their working experience with referral of women of childbearing age particularly their motivating factors. These findings were done relative to the specific objectives of the study. The findings collected were described as such to express women’s experiences on CHW referral and CHWs experiences on client referral.
The study took a period of one year from June 2016 to June 2017. Data was collected for the period August 2015 to June 2016.
All the four Health Districts carrying out Community Performance Based Financing were involved in the study. Women within child bearing age who were eligible for the study were systematically sampled from the Community. Every 3rd house beginning from any junction was considered and every woman of child bearing age who met the inclusion criteria and was not cognitively impaired within the home was interviewed. The next eligible case was taken until the sample size was obtained. For CHWs, their names were written on pieces of papers and folded. Potential respondents were then randomly picked from the folded papers.
The sample size of this study was calculated using the following formular
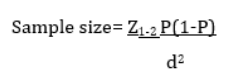
Where Z1-α2= Standard normal variate at 5% type 1 error (P<0.05=1.96)
P= expected proportion in the population based on previous studies (0.527)
d=Absolute error or precision considered by researcher at 0.05

The sample size considered for this study was at 272 Women of Child bearing age and CHWs in the Four Health Districts. 200 women of child bearing age (50 per Health District) and 72 CHWs (18 per Health District) were considered for the study.
This study made use of two data sources, Primary and Secondary. Information on the levels of MCH indicators and those for CHWs were obtained from Electronic databases.
A Questionnaire with closed and open ended questions was used to elicit response from respondents regarding the influence of CHWs on the uptake of MCH indicators. Still using a questionnaire, responses were also elicited from CHW on motivation factors influencing patient referral.
The data was entered using SPSS 20 and described using descriptive and inferential statistics. Descriptive statistics employed the use of frequency distribution tables and cross tabulations. Inferential statistics was achieved using the chi squared test.
For social marketing (CHWs and others) four out of the Nineteen Health Districts in the Northwest Region were involved in the Study as only these four were into CPBF at the time of the study.
Indicators for Maternal and child service considered were ANC, Delivery, immunization, Family planning and Post Natal Consultation.
An authorization to do research was obtained from the Regional Delegation of Public Health-North West Region, the Kumbo East District Health Service, the Ndop District Health Service, the Nkambe District Health Service and the Fundong District Health Service. An authorization was also obtained from the Manager of the Performance Based Financing project in the North West to use project data for this study.
The participants were told the Research topic and verbal consent was obtained prior to interview sessions. They were also informed that they had the right to refuse participating or to discontinue whenever they wished to. They were assured that the information given will be used solely for the purpose of the study and at no time will their personal information be made public.
A total of 200 women of child-bearing age and 72 Community Health Workers from four Health Districts comprised this study. Two sources of data were used for the study, a primary and secondary source. For the primary source, the questionnaire was used to illicit responses from women of child bearing age and CHWs. For the secondary source of data, electronic sources of data were used to obtain levels for MCH service uptake and production for CHWs; these two were then compared. Primary source of data was entered using SPSS 20 and described using descriptive and inferential statistics. The data was represented graphically using simple bar and pie charts. Descriptive statistics employed the use of frequency distribution tables and cross tabulations. Inferential statistics was achieved using the chi squared test. Data was considered significant at p<0.005 for up to 10%. Using the barrier method, for p value less than 5%, result was considered significant, between 5% and 10%, there was a possible difference, greater than 10% no difference.
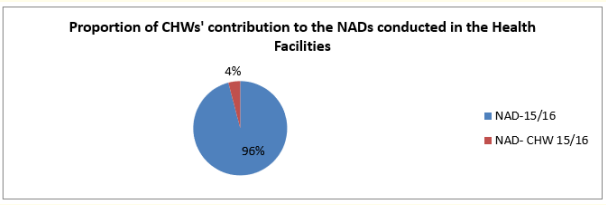
Figure 1: CHWs’ contribution to NADs conducted in the Health facility between August 2015 to July 2016.
CHWs referred 4% of all deliveries conducted in the health facility from August 2015 to July 2016 while 96% came of their own accord.
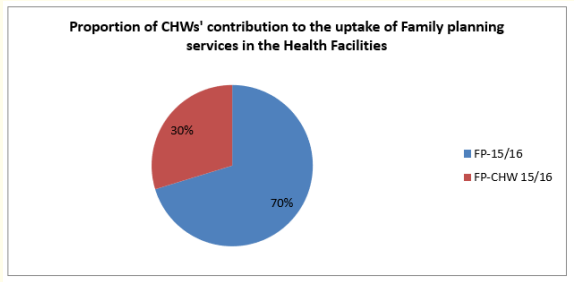
Figure 2: CHWs’ contribution to Family Planning done in the Health facility between August 2015 to July 2016.
CHWs contributed up to 30% of all family planning that was done in the Health facilities between August 2015 to July 2016.
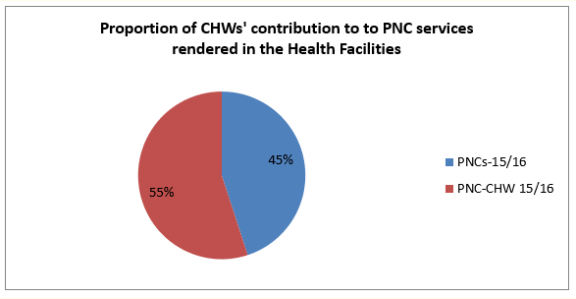
Figure 3: CHWs’ contribution to Post natal consultation done in the Health facility between August 2015 to July 2016.
Of all the post natal consultations done between August 2015 and July 2016, a majority of 55% were referred by CHWs while only 45% came of their own accord.
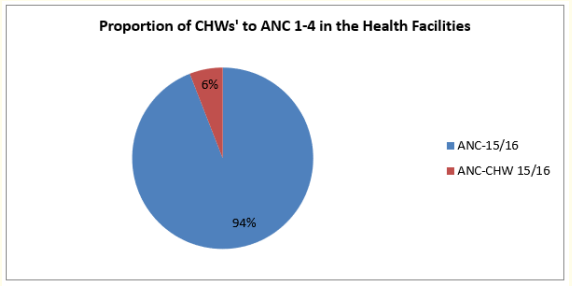
Figure 4: CHWs’ contribution to Antenatal consultation done in the Health facility between August 2015 to July 2016.
6% of all ANC done in the Health facility from August 2015 to July 2016 were referred by CHWs while a majority of 94% came for ANC with no referral from CHWs.
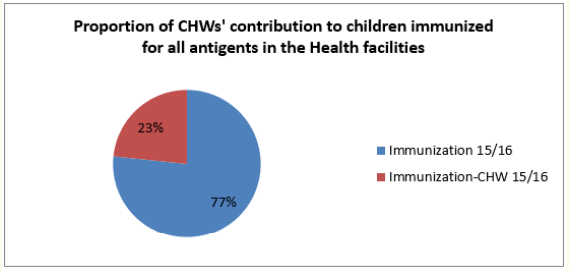
Figure 5: CHWs’ contribution to Children immunized for all antigen done in the Health facility between August 2015 to July 2016
For children immunized for all antigens between August 2015 to July 2016, 23% were referred by CHWs while 77% came of their own accord.
In table 1 above, the age range of the respondents can be seen. The majority of respondents (48.6%) were between the ages 19 to 30 years, followed by those between 31 to 40years who made 36.1% of the respondents. The minority of 15.3% was found to be between ages 41 to 50 years.
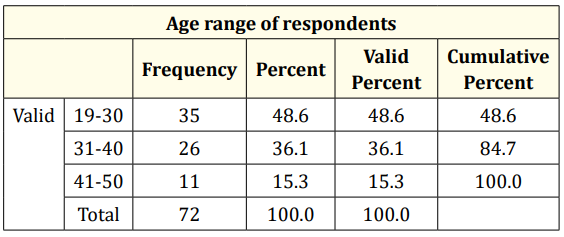
Table 1: Age range of respondents.
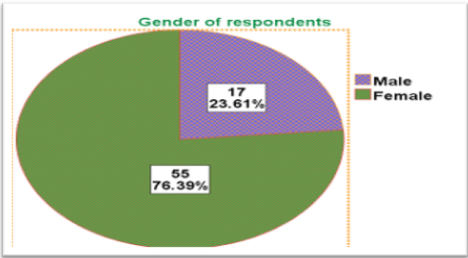
Figure 6: Gender of respondents.
From the pie chart above, it can be observed that 55% of the respondents are female while only 17% are male.
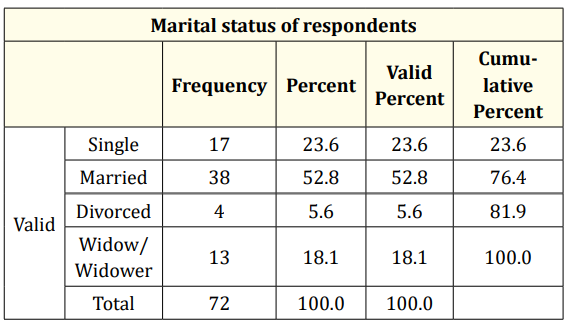
Table 2: Marital status of respondents.
According to the table above, the greatest proportion (52.8%) of the respondents is married, 23% are single, and 18.1% is widowed while the least percentage of 5.6% is divorced.
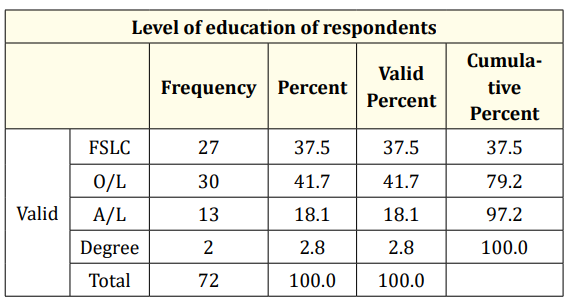
Table 3: Distribution of Level of Education of Respondents.
A majority of the respondents that is 41.7% had an Ordinary level certificate, 37.5% had a First school leaving certificate, and 18.1% had an advanced level certificate while the minority of 2.8% had a degree.
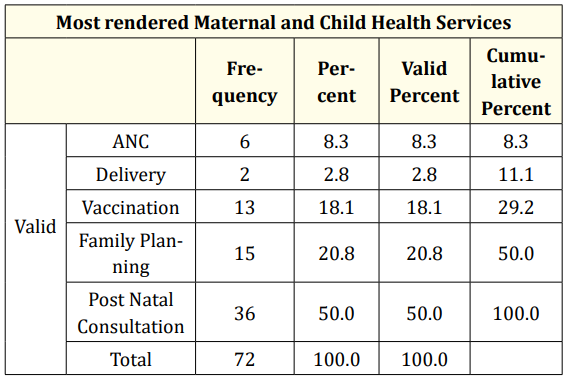
Table 4: Services most rendered by CHWs.
A majority of CHWs (50.0%) refer clients for Post Natal Consultation most of the time, 20.8% refer for family planning, 18.1% refer for vaccination, and 8.3% refer for ANC; the least referred indicator is delivery which stands at 2.8% referral.
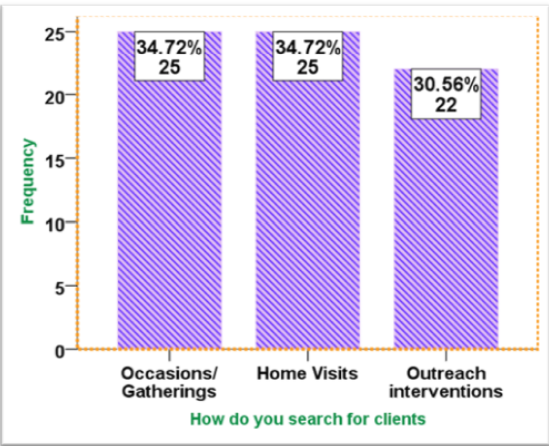
Figure 7: How CHWs search for Clients.
A majority of the respondents (34.72%) indicated that they search for clients in occasions and the same percentage (34.72%) indicated that they search for their clients during home visits. The smallest percentage of 30.56 said their clients are searched during outreach interventions.
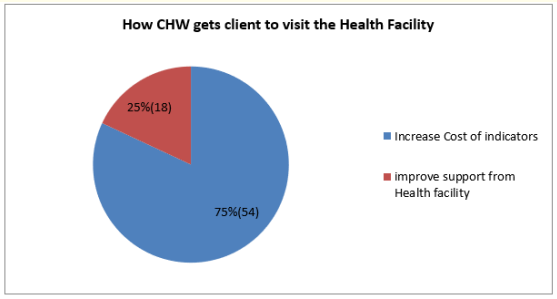
Figure 8: How CHW gets client to visit the Health Facility.
According to the figure above, a majority of CHWs (75%) get the client to visit the Health facility by way of referral notes while a minority of 25% take the client in person to the Health Facility.
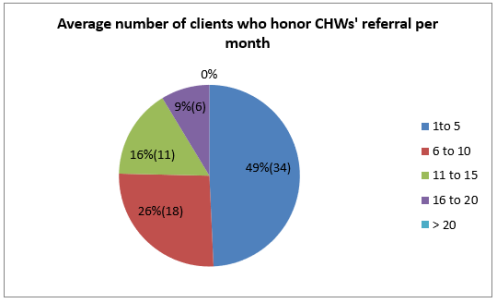
Figure 9: Average number of clients who honor CHWs’ referral per month.
On the Average per month a majority (49%) of the respondents indicated 1 to 5 clients honor their referrals in a month, 26% said 6 to 10 clients honor their referrals per month, 16% said 11 to 15 clients honor their referrals per month while 9% said 16 to 20 clients honor their referral per month. No respondent reported that they could have an average of more than 20 clients who honor their referral per month.
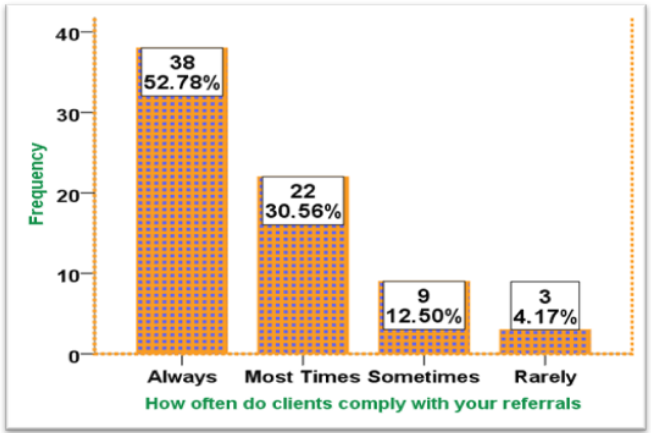
Figure 10: Clients’ compliance frequency with CHWs referral.
According to the above figure, a majority of the respondents (52.78%) indicate that the clients they refer always comply, 30.56% indicate that the clients comply most times, 12.50% indicate that the clients comply sometimes while 4.17% indicated that the clients rarely comply with referrals.
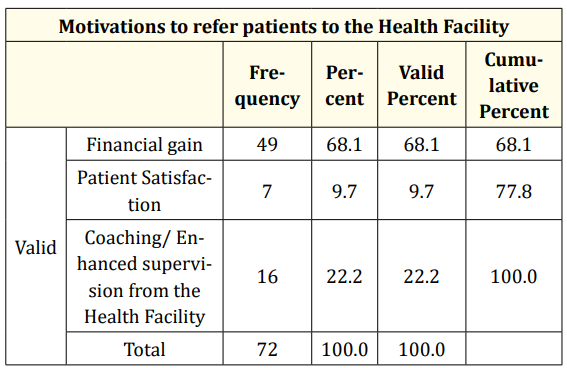
Table 5: Distribution of CHWs’ motivating factors.
According to the above table, the highest proportion of the respondents (68.1%) are motivated by financial gain, 22.2% are motivated by enhanced supervision and coaching from the Health facilities and the least percentage of 9.7 are motivated by patient satisfaction.
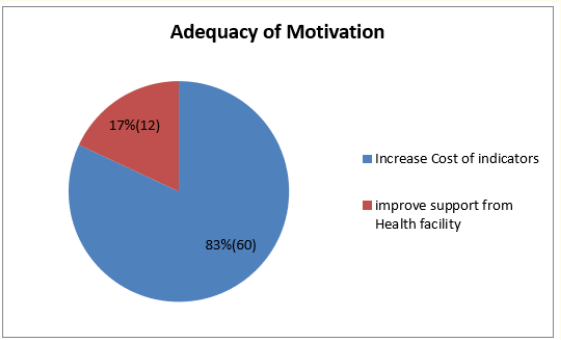
Figure 11: Adequacy of Motivation.
A majority of the respondents (83%) is not satisfied with their motivation as CHWs while the minority (17%) is satisfied (Figure 12).
A majority(82%) of the respondents indicated that to improve the motivation of CHWs, cost price per indicator in their package of indicators be increased while the minority (18%) indicated that if the support from the health facility is improved, the CHWs will be better motivated to work.
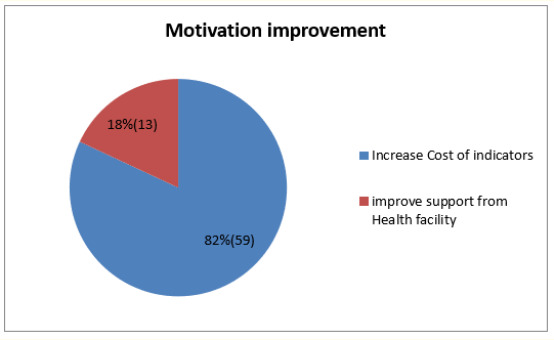
Figure 12: How motivation can be improved.
From the table above, it can be seen that a majority of the work 47% is carried out by those between 19 to 30 years, those between the ages 31-40 years refer 36% of clients while the least referring age group are those between 41 to 50 years who refer only 15% of the clients (Table 7,8).
From the above table it can be seen that males rendered the majority of referrals in ANC, Delivery and vaccination (6.9, 2.8 and 11.1 as against 1.4, 0.0 and 6.9 respectively) while females offered a majority of referrals in Family planning and Post natal consultations (18.1 and 50.0 as against 2.8 and 0.0). In total, males offered only 24% of the total referrals while females offered 76% (Table 9).
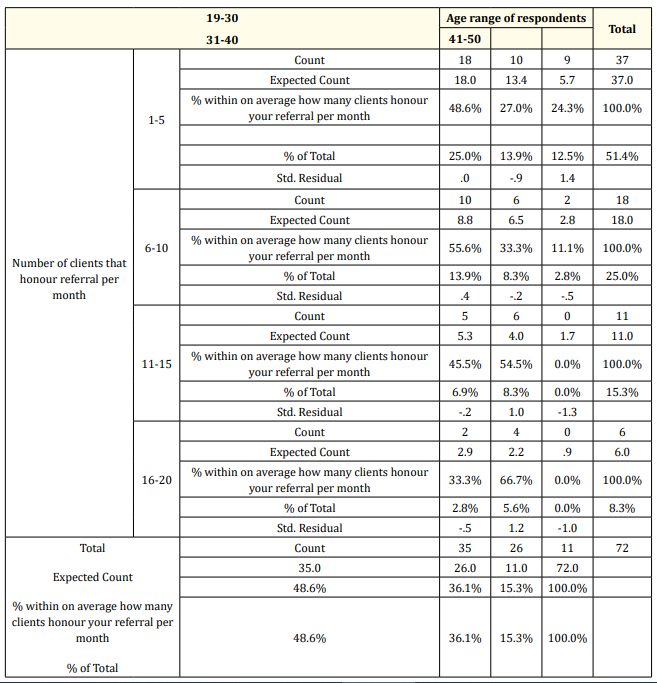
Table 6: Age related to quantity of work done.
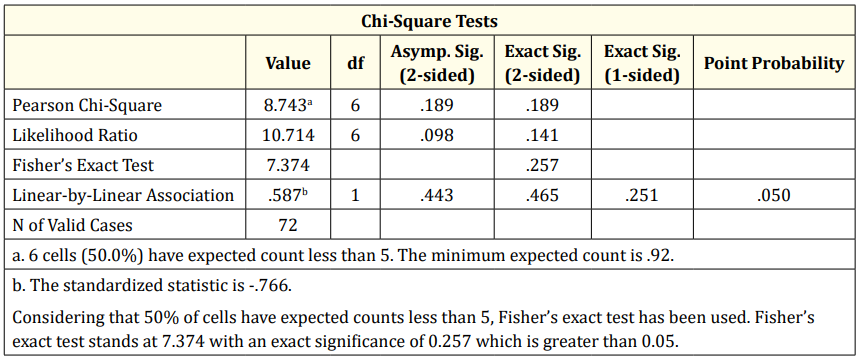
Table 7: Chi-Square Tests.
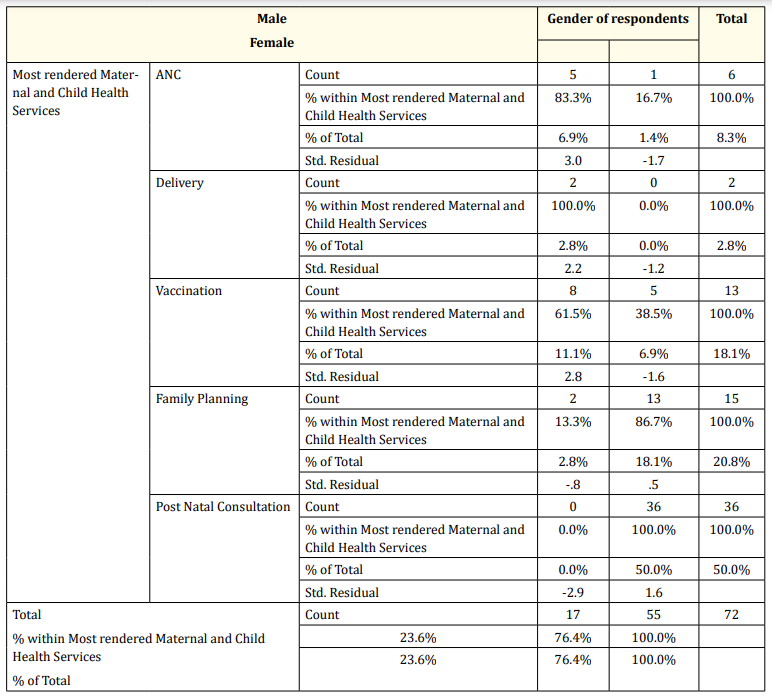
Table 8: Gender related to type of service rendered.
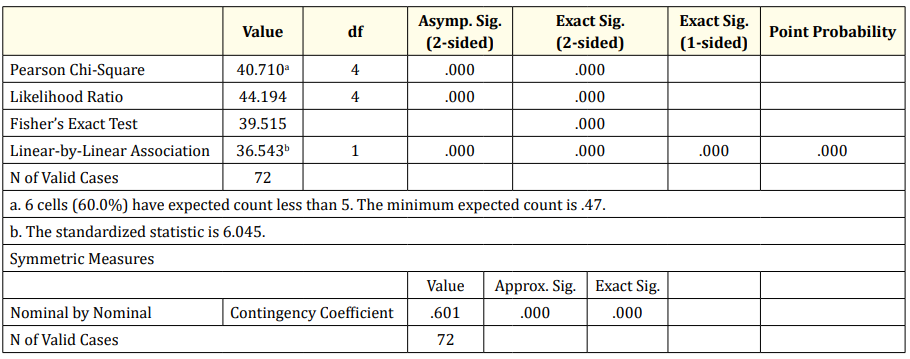
Table 9: Chi-Square Tests.
From the above tables, by Fisher’s exact test, the value stands at 39.515 with exact significance less than 0.001. The nominal contingency stands at .601.
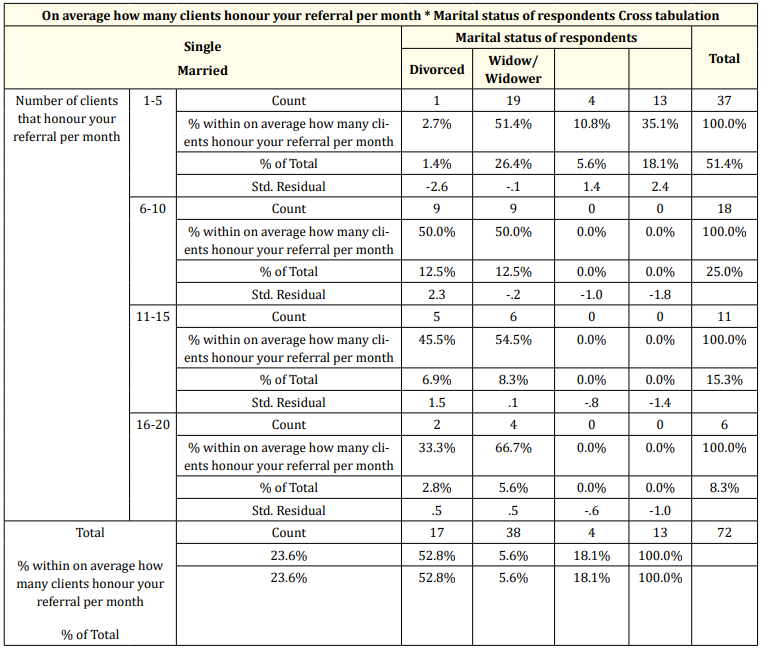
Table 10: Marital status related to quantity of work done.
From the table above, it can be seen that those who are married offer the most number of referrals for each group. In total the married form the highest group (52.8%) of all referrals followed by the single with 23.6%, then then widows/widowers with 18.1%; the least referring group are the divorced with a percentage of only 18.1 of all referrals.
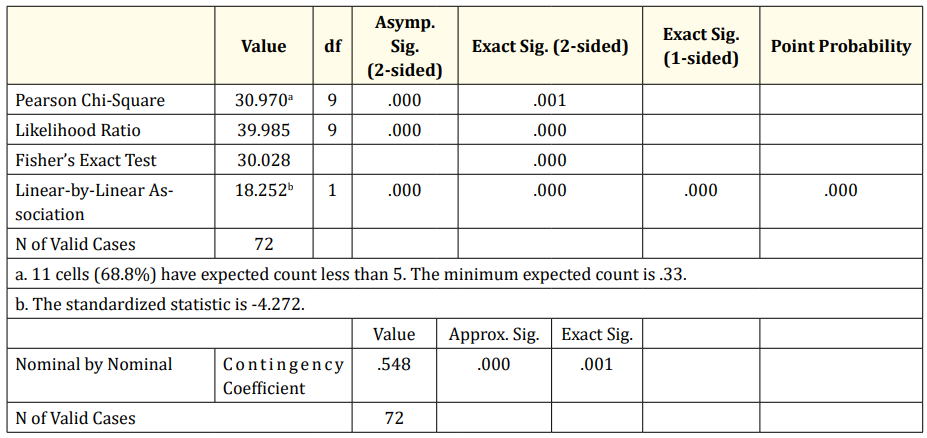
Table 11: Chi-Square Tests.
From the above tables, Fisher’s exact test reads 30.028 at less than 0.001 exact significance. The nominal contingency is .548 at exact significance .001.
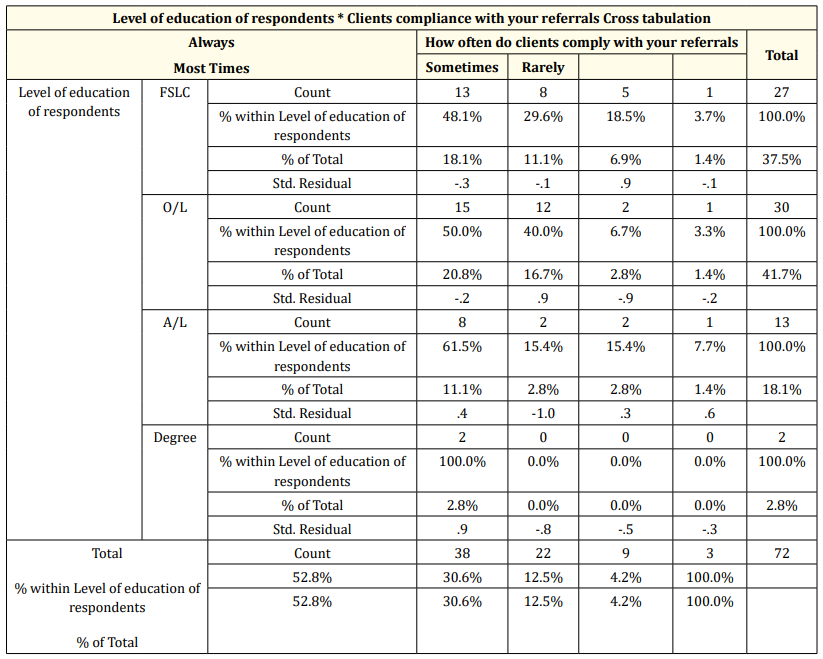
Table 12: Level of CHWs’ education to client compliance.
From the table above, looking at the standardized residual values, First school level refer patients with a greater probability to sometimes comply, Ordinary level refer patients who have a greater probability of most times complying, for the Advanced level the probability is shared between always, sometimes and rarely; the Degree level has a high probability that those they refer will always comply. Compliance rate of “always” and “most times” is highest with the Ordinary level (20.8% and 16.7% respectively), followed by those of the first school level (18.1% and 11.1% respectively), the Advanced level is the next with 11.1% and 2.8% respectively; the Degree level is the least with 2.8% and 0.0% respectively.

Table 13: Chi-Square Tests.
The value of Fisher’s exact test is 7.022 at an exact significance of 0.679 which is greater than 0.05. The nominal contingency is .280 at exact significance .719.

Table 14: How clients are got to visit the Health facility related to clients’ compliance.
From the above table it can be seen that 41.7% of clients referred through referral notes always comply as against 21.1% who are brought in person. 81.8% comply most times when they receive a referral note as against 18.2% who comply when brought in person, 6.9% of the clients comply sometimes when referred with a note as against 5.6% who are brought in person and 1.4% of clients rarely comply when referred with notes as against 2.8 who rarely comply when brought in person. Total compliance is seen to be 75% for those referred through a referral note and 25% for those brought in person.

Table 15: Chi-Square Tests
Fisher’s exact test stands at 5.210 with an exact significance of 0.137 which is greater than 0.05, the nominal contingency is .265 at exact significance .140.
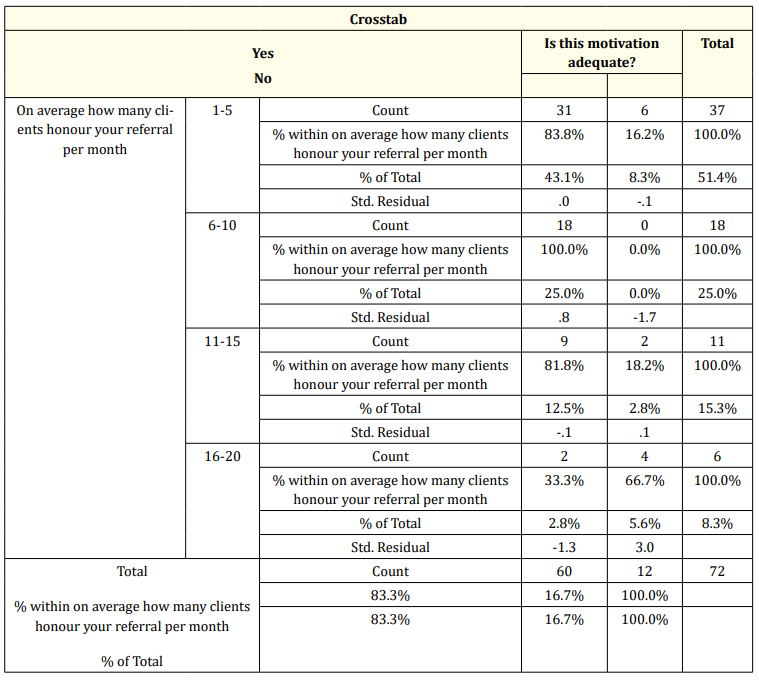
Table 16: Perception of adequacy of motivation related to quantity of work done.
From the table above, it can be seen that the highest proportion of work is done by those who think the motivation is adequate 83.3% while 16.7% who think motivation is not adequate do the least amount of work.
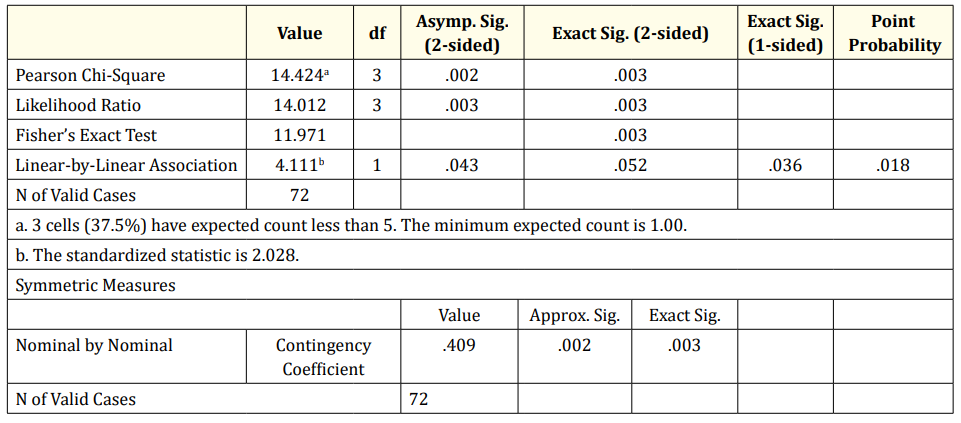
Table 17: Chi Square tests.
From the above table, Fisher’s exact test value is 11.971 with an exact significance of 0.003. The Nominal contingency is 0.409 at exact significance 0.003.
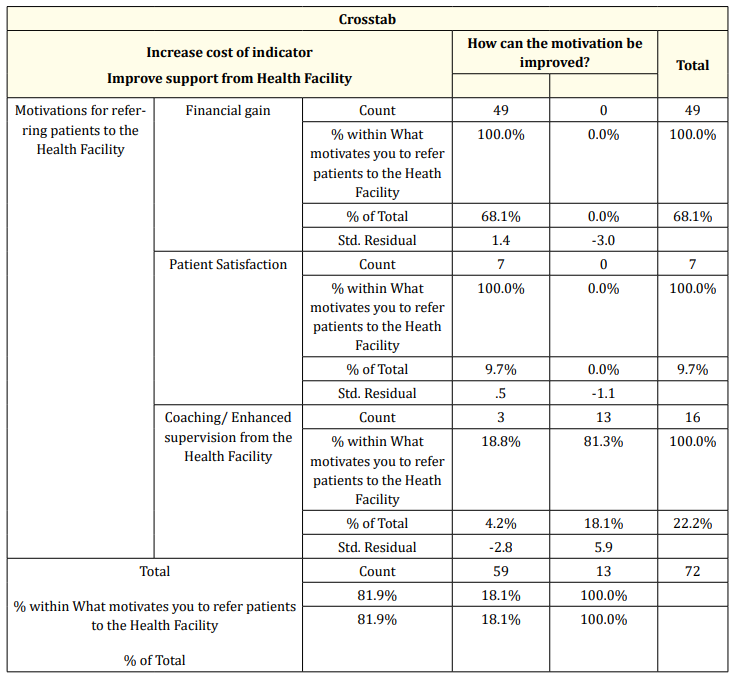
Table 18: Motivating factor related to suggestions for improvement.
From the above tables, Fisher’s exact test is 46.941 at exact significance less than 0.001. The nominal contingency is .660 at exact significance less than 0.001.
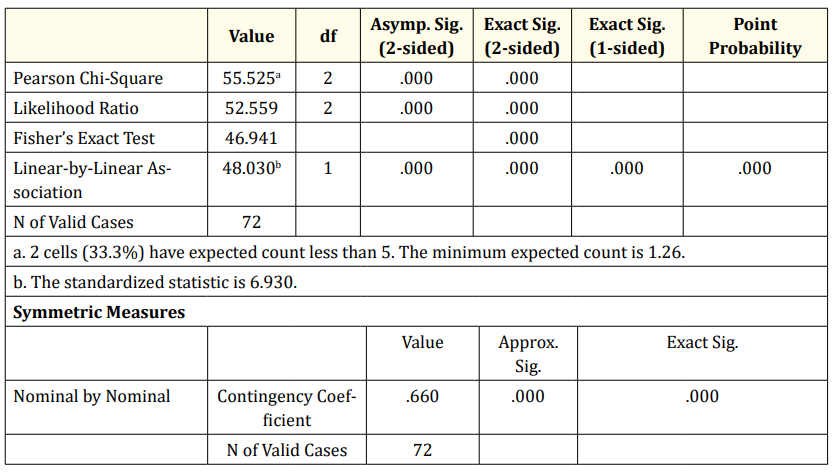
Table 19: Chi-Square Tests.
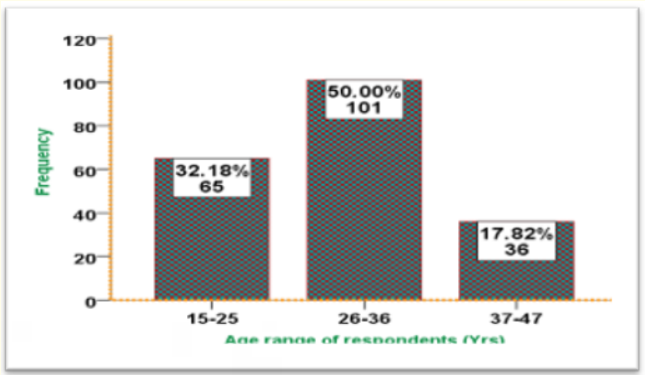
Figure 13: Age distribution of respondents.
From the above figure, the majority or clients (50%) are between the ages 26 to 36 years, next in line are those 15 to 25 years (32.18%); the least for this data set are those between the ages 37 to 47 years (17.82%).
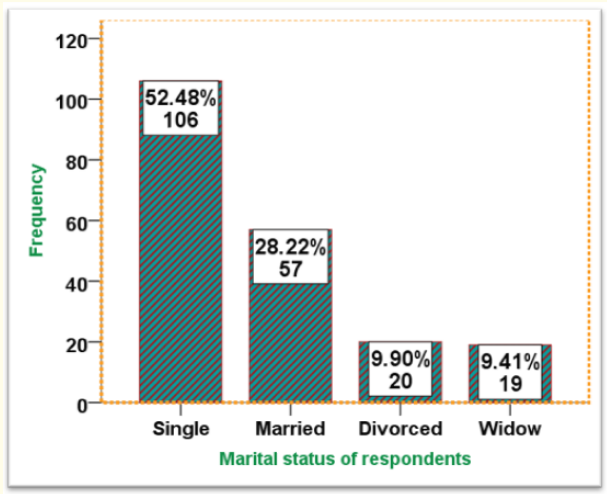
Figure 14: Marital status of the respondents.
The greatest percentage of the respondents were single (52.48%) followed by 28.22% that were single, 9.90% were divorced while the smallest percentage of 9.41% were widowed.
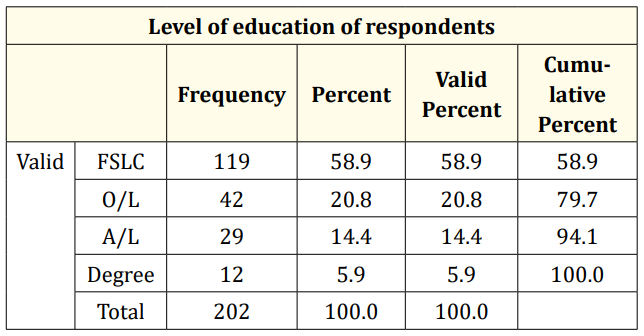
Table 20: Level of Education of respondents
Most of the clients (58.9%) were at the First school level followed by 20.8% who were at the Ordinary level, 14.4% were at the Advanced level while the least percentage of 5.9 were at the Degree level.
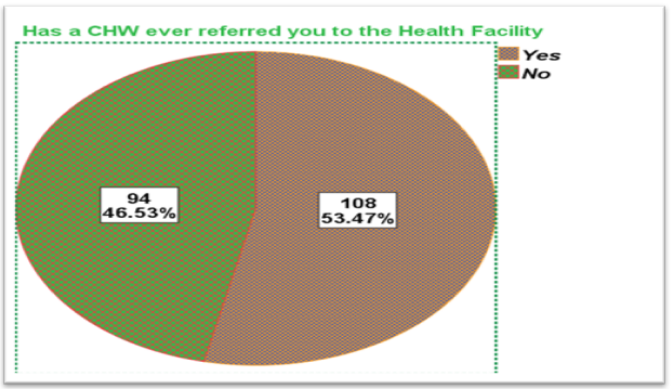
Figure 15: Percentage of Clients referred by a CHW
According to the above figure, 53.47% of clients have ever been referred by a CHW while 46.53 have never been referred.
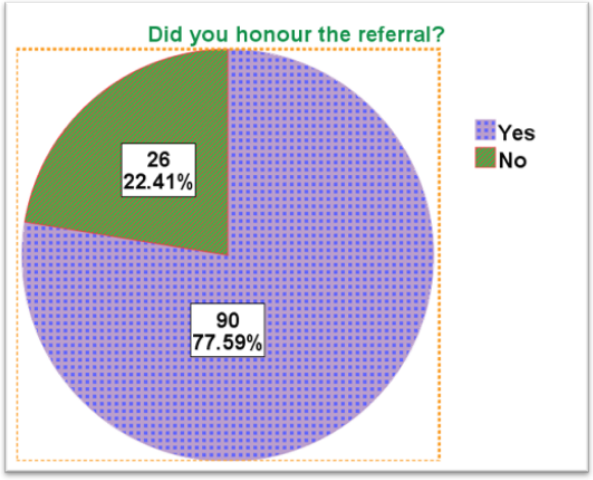
Figure 16: Percentage of clients that honored CHWs’ referrals.
According to the above figure, 77.59% of the referred clients honored CHWs’ referral while 22.41% did not.
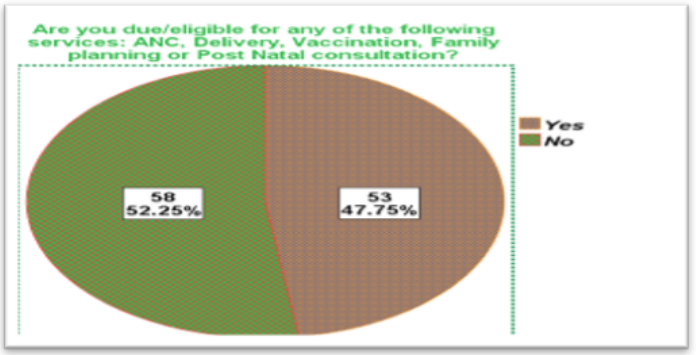
Figure 17: Percentage of clients who did not honor CHWs referral- Care eligibility status.
According to the figure above of those who have never been referred or who have not honored CHWs’ referral, 47.75 were due for at least one of the MCH services while 52.25 were not.
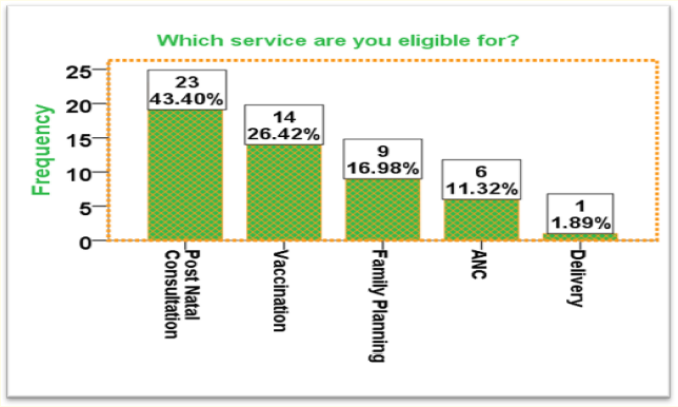
Figure 18: Proportion of eligibility by indicators.
According to the above figure, the indicator most eligible for was Post natal consultation (43.40%), followed by Vaccination (26.42%), next by Family planning (16.98%) and then ANC (11.32%); the least indicator eligible for was Delivery which was at 1.89%.
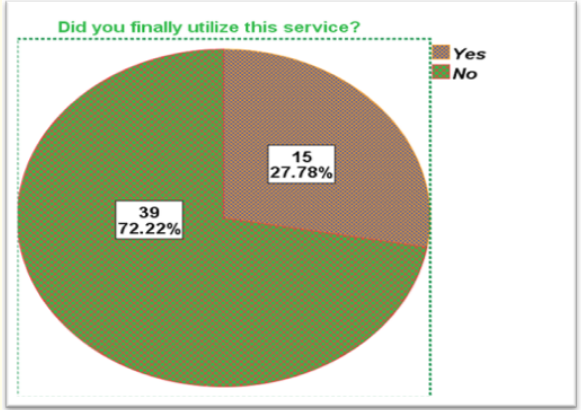
Figure 19: Proportion of clients who were eligible for at least one indicator- indicator utilization state.
With respect to the above figure for those who were eligible for any MCH service but was not referred or did not respect referral, 72% finally utilized the service they were due for while 27.78 did not finally utilize the service.
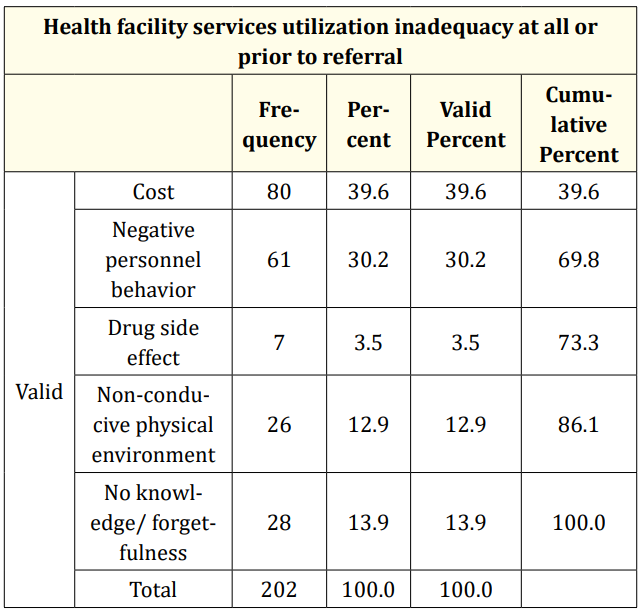
Table 21: Reason for inadequate or no use of MCH service prior to referral.
With respect to the above table, a majority of the respondents (39.6%) did not utilize service as a result of high costs, 30.2% as a result of negative personnel behavior, 13.9% forgot or had no knowledge, and 12.9% said the environment was not conducive while the smallest percentage of 3.5 said it was because of drug site effect.

Figure 20: Clients’ prior intentions before CHWs’ referral.
With respect to the above figure, 64.2% of the clients had no intention of using the Health facility prior to the referral of the CHW while 35.8% had a prior intention.
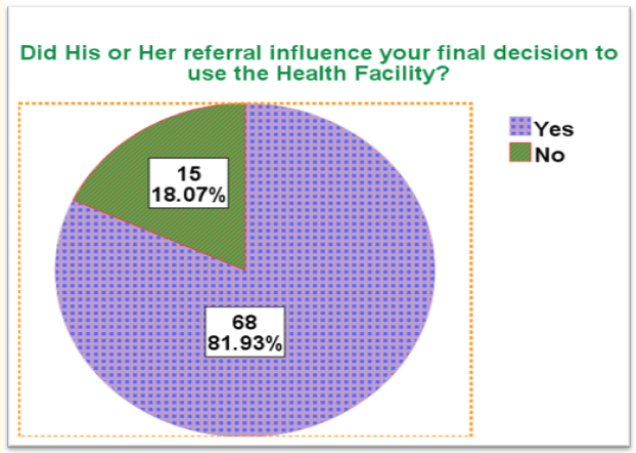
decision to utilize Health service.
With respect to the above table, 81.93% of the clients perceive that CHWs’ referral influenced their final decision to utilize the Health facility while 18.07% perceive that CHWs’ referral did not influence their utilization of the Health facility.
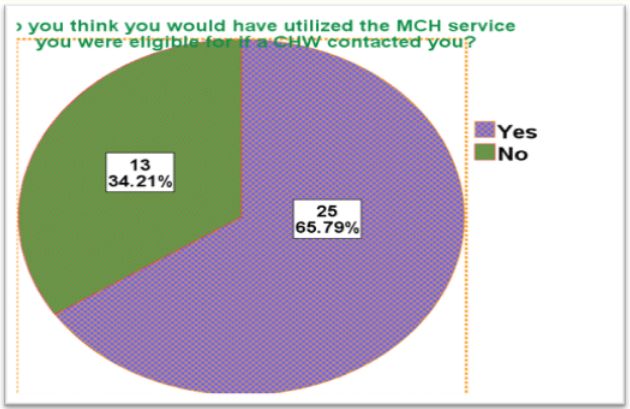
Figure 22: Clients’ perception of whether they would have utilized MCH service they were eligible for if a CHW had referred them.
According to the above figure, 65.79% of the clients indicated that should they have been referred by a CHW, they would have honored the referral while 34.21% think that should a CHW have referred them, they would not have honored.
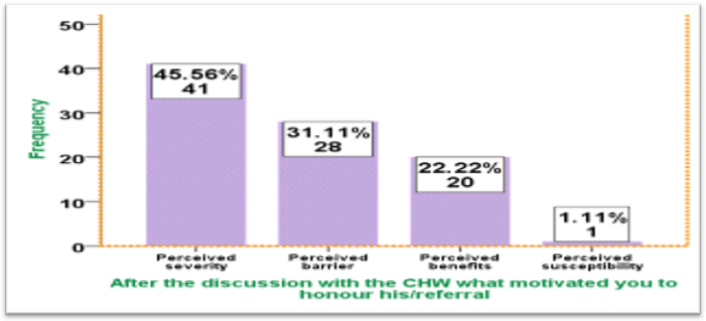
Figure 23: Clients’ reasons for honoring CHW referrals.
According to the above figure, most of the respondents (45.56%) honored CHWs’ referral because of perceived severity of disease, 31.11% were convinced that they could overcome any perceived barrier, 22.22% because of perceived benefits and the least percentage of 1.11% because they perceived that they were susceptible (Table 22).
According to the Table 22 the indicator most referred for per age group is Post natal consultations with those 15-25 years making 80%, those 26-36 years making 23.5% and those 37-47 years making 4.9%. in total the highest indicator referred for was Post natal consultation which stands at 44.1% while the least is ANC which stands at 2.0%. Vaccination makes 30.4%, Family planning makes 17.6% and Delivery makes 5.9% (Table 23).
Fisher’s exact test is 42.602 at an exact significance of less than 0.001, the nominal contingency is 0.558 at exact significance less than 0.001 (Table 24).
According to the Table 24, a majority of the singles was referred for Post natal consultation (28.4%), a majority of the married was referred for Family planning (9.8%), a majority of the divorced was referred for Vaccination(7.8%) and a majority of the Widows were also referred for Post natal consultation (8.8%). In total, the highest indicator referred by the CHWs was Post natal consultation at 44.1%, followed by Vaccination at 30.4%, then Family planning at 17.6%, Delivery at 5.9% and ANC at 2.0% (Table 25).
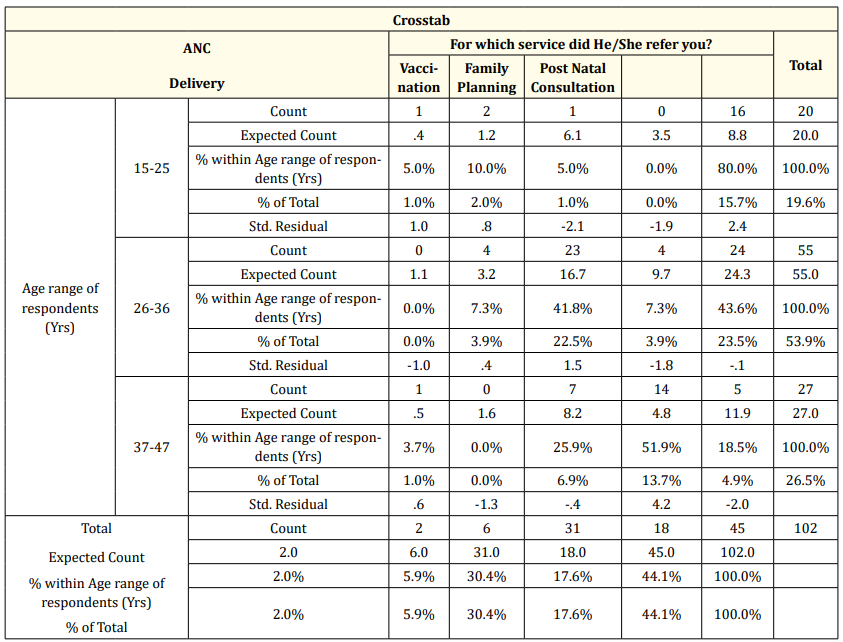
Table 22: Age related to service client was referred for.
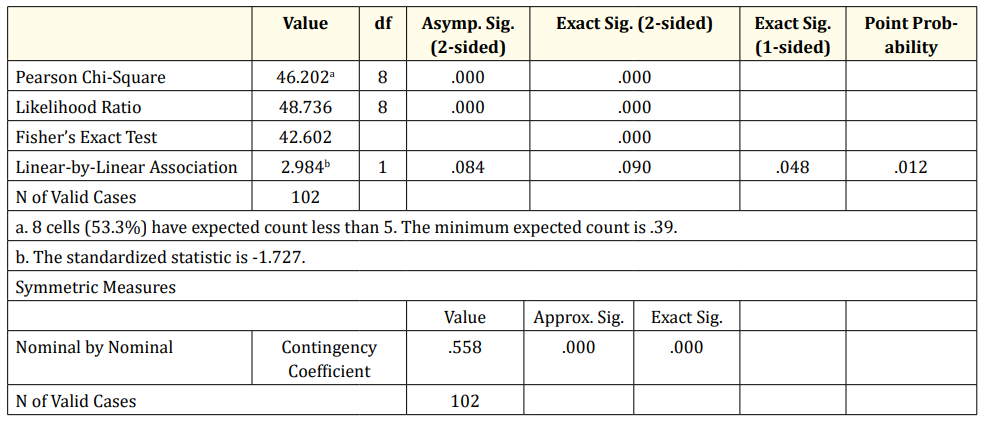
Table 23: Chi-Square Tests.
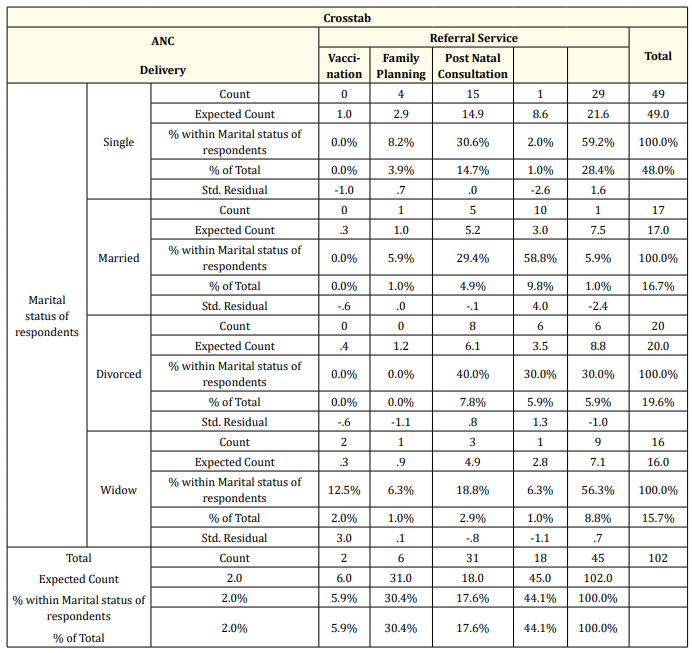
Table 24: Marital status related to which service client was referred for.
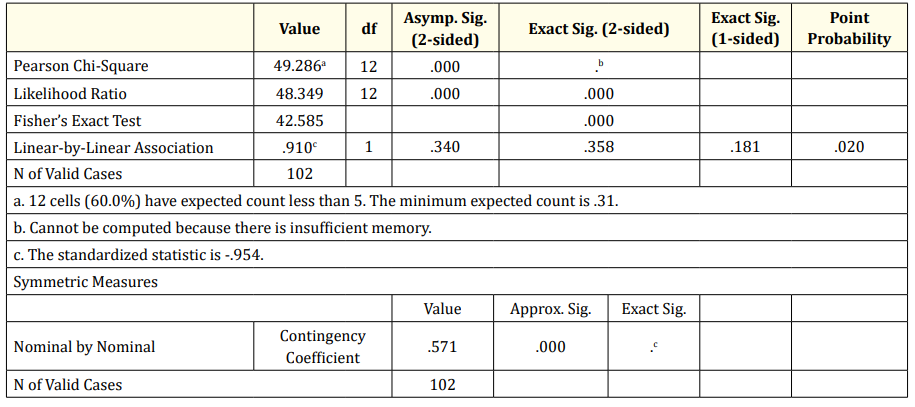
Table 25: Chi-Square Tests.
From the above tables, Fisher’s exact test stands at 42.584 with exact significance less than 0.01. The nominal contingency is at 0.571.
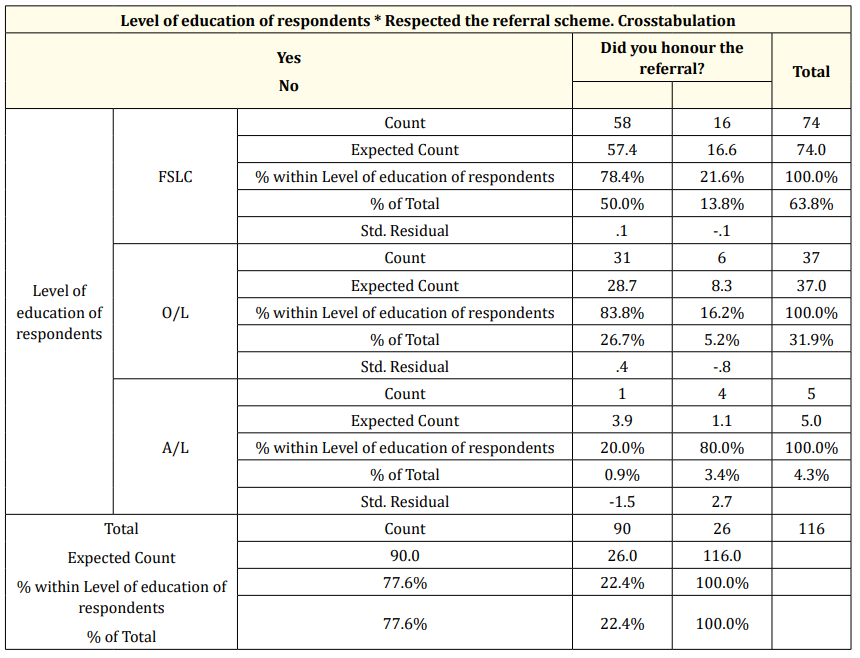
Table 26: Clients’ level of Education related to whether they honored CHWs’ referral.
According to the above table, the highest percentage of those who honored referrals were those at the First school level (50%) as against 13.8% who did not. 26% of those at the Ordinary level honored CHWs’ referral as against 5.2% who did not. 0.9% of those at the Advanced level honored referral while 3.4% did not. In total, 77.6% of the respondents honored the referrals while 22.4% did not.
Fishers exact test stands at 8.222 with exact significance of 0.014 which is less than 0.05. The nominal contingency value is 0.287 with exact significance of 0.009 (Table 28).
According to the Table 28, up to 70.4% who were eligible for MCH indicators did not finally utilized the service while only 27.8% utilized the service they were eligible for (Table 29).
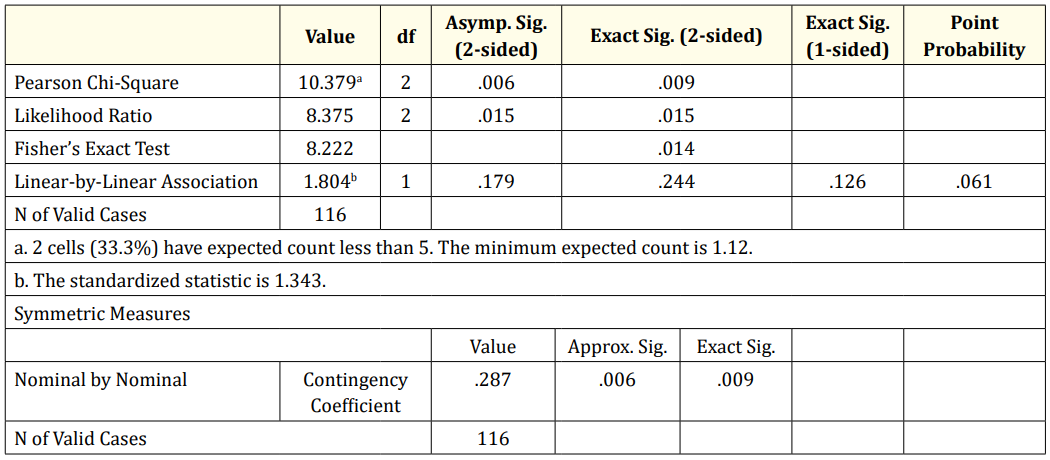
Table 27: Chi-Square Tests.
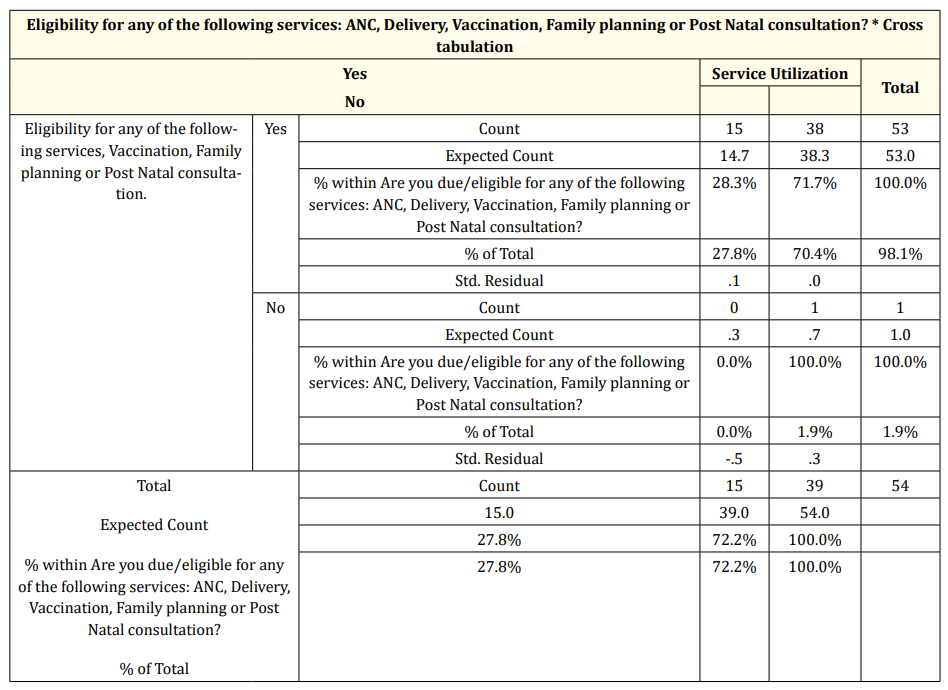
Table 28: Client indicator eligibility related to final use of service.
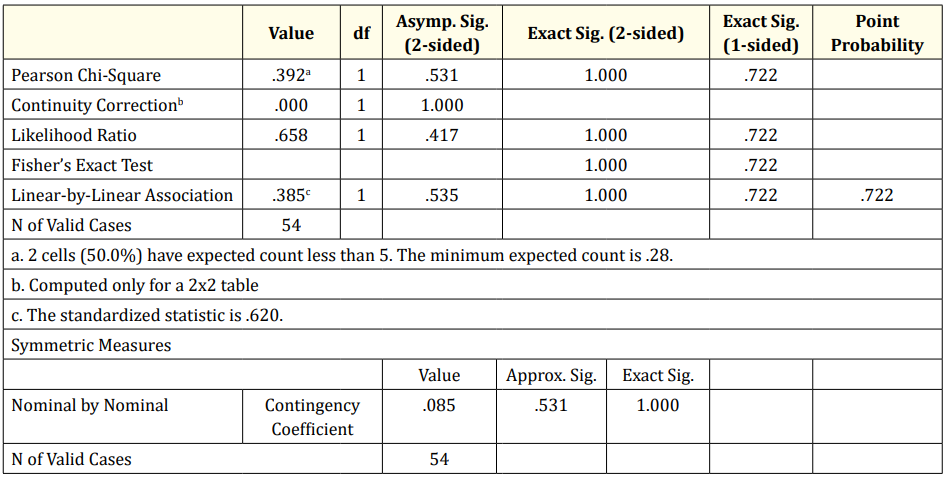
Table 29: Chi-Square Tests.
Linear-by-linear value stands at .385 with exact significance of 1.000 which is greater than 0.05. Nominal contingency is .085 at exact significance 1.000.
This study made use of the cross-sectional study method with primary and secondary sources of data employed to obtain information on the impact of CHWs’ work on the uptake of MCH services in the Health facility. Aspects of respondents’ demography like age, sex and level of education will be discussed under generalities. For purposes of clarity, the other aspects of the study will be discussed under the specific objectives.
From the study it can be seen that the quantity of work done decreases with increase in age as it can be seen that those 19-30years do the greatest percentage of the work (47%) while those 41-50years do the least (15%). Fishers exact test indicates a value of 7.37 with exact significance of 0.257 when relating age to quantity of work done. This indicates that the effect of age on quantity of work done is not significant. This finding is contrary to the research findings of Global Journal of health Science (2012), on effect of social-demographic characteristics of CHWs on performance of home visit during pregnancy where it was ascertained that there was a significant relationship between age group than other and good record with tasks performance.
The majority of CHWs were female (76.39%) while the minority was male (23.61%). Analysis on the relationship between gender and type of MCH indicator referred showed that, males rendered a majority of ANC, Delivery and Vaccination services while females rendered a majority of Family planning and Post natal consultation services. Fisher’s exact test value was 39.5 at an exact significance less than 0.001. This indicates a significant relationship between gender and type of MCH service rendered. From this it can be said that female clients prefer females for family planning and Post Natal consultations. For family planning, this may be because this is a sensitive issue and is sex sensitive and women may tend better trust their female counterparts. This is in line with the study carried out by by Bagonza J., et al. [3] where they found out that females are performing well.
Looking at the marital status of the CHWs, the majority of 52.8% was married while the minority of 5.6 was divorced. Relating marital status to quantity of work done, it was seen that the married did the greatest share of the work (52.8%) while the least share was carried out by the divorced (18.1%). Fisher’s exact test shows a significant relationship between marital status and quantity of work done as the value stands at 30.028 with exact significance at 0.001. This finding is in line the study carried out by Ndangurura Denys in August 2015 on Assessment of Community Health Workers Incentives on Maternal and Newborn Health Services Performance in Rwanda which found out that, the married are the predominant among other represented by 168 (71.1%) then widow/ Widower 60 (25.4%), one was divorced and 7(3.0) were single.
From the study it can be observed that, a majority of the respondents had attained the secondary school level (41.7%) while the minority of 2.8 had a degree. Relating level of education to clients’ compliance, it was observed that there was more client compliance with the lower levels of education than with the higher levels (OLevel 20.8%, FSLC 18.1%, A-level 11.1% and Degree level 2.8%). Notwithstanding fisher’s exact test at value 7.022 and exact significance 0.619 indicates a non-significant relationship between level of education and clients’ compliance. This relates to the research carried out by Global Journal of health Science (2012), which shows that CHWs with lower literacy levels satisfy and enable their clients effectively.
The highest percentage of clients were found in the age group 26-36years which makes 50% of the respondents while the least was the age group 37-47years making 17.82% of the respondents. Relating age to type of service referred for, the age group 15-25years were most times referred for Post natal consultations and ANC that of 26-36years were referred for Vaccination and Delivery; the age group of 37-47years were referred for Family planning and ANC. Fisher’s exact test indicates a significant relationship between age and type of service rendered as its value is 42.60 at an exact significance of 0.001.
A greater percentage of the respondents had attained the First school leaving certificate (50%) while the least percentage of 0% had a degree. Relating clients’ level of education to their honor of CHWs’ referral it was observed that First School leavers honored referral most than any other educational level. First school leavers stand at 50% honor of referrals while O-Level and A-Level stand at 26% and 3.4% respectively. Fisher’s value stands at 8.22 with an exact significance of 0.014 indicating a significant relationship between respondents’ level of education and compliance with referral. It can therefore be said that compliance decreases with increasing educational level probably related to the fact that at a lower level of education, people have little or no information on health related matters and could easily be thought unlike their more learned counterparts.
From available data, it is observed that in total, CHWs contribute a total of 23.6% to all MCH services rendered in the Health facility. This is in accordance with a study carried out in June 2015 by Jaime Havier., et al. on Experiences engaging community health workers to provide maternal and newborn health services: Implementation of four programs. It was observed from the study that, Between July 2010 and June 2011, a total of 2433 ASMs in six of the 30 districts in Rwanda received training in community-based MNH. In the same time period, in those six districts, 19 248 pregnant women were accompanied to the health center for pregnancy-related danger signs identified by the ASMs, and 52.7% of women who delivered in a facility were accompanied by ASMs (ASMs are another form of CHWs). It can therefore be said that, CHWs contribute significantly to MCH service uptake in the Health Facilities.
In the entire study population, 53.47% has once been referred by a CHW within the study period while 46.53 have never been referred. This implies that CHWs have coverage of a little above 50% of the population in a year.
Of those referred, 77.59% complied while 22.41did not. 53% of those referred always comply while only 4% rarely comply. This implies that a greater proportion of those referred by CHWs comply most of the time indicating that referral for most times is effective.
A majority of the respondents who were referred by a CHW and complied (52%) had no prior intention of visiting the health facility while 36% had a prior intention of visiting. Again a majority of clients (82%) perceived that CHWs referral influenced their final decision to utilize the MCH service while only 18% perceive that they would have gone on their own without the influence of CHWs. This indicates that CHWs to a larger extent influence clients (who otherwise would not have visited the Health facility) to utilize the MCH service they are due for.
Of those who have never been referred or who did not honor CHWs’ referral but were eligible for at least one MCH service, 72% finally utilize the service they were due for while up to 27% did not finally utilize the service they were due for. Most of the respondents (65.79%) indicated that they would have utilized the service they were eligible for should they have been referred by a CHW while 34% indicated that they still would not have utilized the service they were eligible for even if referred by a CHW. This indicates an unmet client referral need and emphasizes the effect CHWs have on the uptake of MCH services as failure to refer by CHW is seen to influence client turn out in the Health facility.
Up to 31% of referred clients who complied indicated that, they complied as a direct result of CHWs’ persuasion to overcome perceived barriers to MCH service uptake. This implies that, CHWs have the ability positively influence service uptake by means of convincing the client.
A majority of CHWs (68%) indicate that they are motivated by financial gain, 22% are motivated by enhanced supervision while the minority of 9.7% is motivated by patient satisfaction. This implies that finance is the main motivational factor influencing productivity with respect to CHWs’ work. This finding is in line with the study carried out by Ndangurura Denys in August 2015 on Assessment of Community Health Workers Incentives on Maternal and Newborn Health Services Performance in Rwanda which found out that Community Health Workers who perceive the financial incentives to be high are about 3 times as likely to perform in maternal and newborn health services.
Regarding CHWs’ satisfaction, a major portion of the respondents (83%) indicated their lack of satisfaction with the current state of motivation as they indicated that it was inadequate while 17% were satisfied with the motivation. This certainly has a bearing on the quantity of work done as a majority of respondents that perceived their motivation to be inadequate produced less than those who perceived the motivation to be adequate. The relationship between perception of adequacy of motivation related to quantity of work done was seen to be one which was significant.
With respect to the proposal for improvement relating to motivating factor, 68% of those who are motivated by financial gain desire for the cost of indicators to be increased while 0% desires improved support from the Health facilities. 9.7% who are motivated by patient satisfaction desire that the cost per indicator be increased while 0% desires improved support from the Health facilities.4.2% of those who are motivated by coaching /enhanced supervision from Health facilities think that the cost per indicator be increased to improve motivation while 18.9% desire improved support from the Health facilities. In total, a majority of 81.9% think that they will be better motivated if the cost per indicator was improved while the minority of 18.1% desire improved support from the Health facilities. Fisher’s exact test value is 46.94 at an exact significance of less than 0.001indicating that there is a significant relationship between motivating factor and proposals for improvement. This implies that even those who are not motivated by finances think that as a way forward, payments to CHWs should be improved as a way of improving upon motivation. This in line with the research conducted by Basics II 2001, on community health workers incentives and disincentives on how they can affect motivation, retention and sustainability where they found that employment as the key incentives that can motivate CHWs to perform better the tasks assigned to them.
Reasons advanced for no or poor MCH service utilization prior to CHWs’ referral are high costs, negative personnel behavior, forgetfulness or lack of knowledge, non-conducive environment and drug site effect. Most of the respondents (39.6%) indicated that costs and negative personnel behavior (30.2%) were a deterring factor while the minority of 3.5% complained of drug site effect. This implies that at the level of the health facility if the above mentioned factors are addressed, this may improve MCH service uptake.
Despite the above reasons for no or poor MCH service uptake, some clients finally utilized the MCH services. These are some reasons advanced for service utilization: after talking with the CHW, clients respected referrals because of perceived severity, they were able to overcome perceived barriers, perceived benefits and perceived susceptibility. The reason most advanced as that of perceived severity (45.56) while that least advance was perceived susceptibility (1.11%). From this, it can be seen that CHWs can influence client MCH service utilization in any of the above ways depending on which relates to client need [4-35].
The main aim of this study was to provide evidence based information to policy makers on how to improve upon the uptake of MCH services.
Following the discussions above, it can therefore be concluded that women of child bearing age are more likely to accept and utilize the MCH packages when referred by a CHW than when not referred. This can be seen as a significant population of those who were not referred ended up not utilizing the MCH service they were eligible for Community Health Workers can be seen to contribute significantly to MCH service uptake in the Health facility as they play a significant role of convincing and referring clients for MCH services. Their work can therefore be seen to have an undisputable effect on MCH service uptake as a majority of clients indicated that their final decision to utilize the service was because of CHWs’ referral and many also indicated that had they been referred by a CHW, they would have utilized the service they were eligible for. This therefore indicates that despite the work done by CHWs, there is still an unmet need of clients who need CHWs’ referral.
It can also be concluded that the main motivating factor among others for the CHW is financial incentive. The role of financing in CPBF cannot be overemphasized as the study brings out the desire of the main stakeholder which is increased financial incentive.
No or poor MCH service utilization by clients is mainly related to high costs and poor personnel behavior. These deterring factors are seen to have a significant effect on MCH service uptake but for the role of CHWs in convincing the clients to overcome deterring factors.
Copyright: © 2019 Bodzewan Emmanuel Fonyuy., et al. This is an open-access article distributed under the terms of the Creative Commons Attribution License, which permits unrestricted use, distribution, and reproduction in any medium, provided the original author and source are credited.


 Open Access by
Acta Scientific is licensed under a Creative Commons Attribution 4.0 International License
Open Access by
Acta Scientific is licensed under a Creative Commons Attribution 4.0 International License
Based on a work at https://actascientific.com
ff
ff
© 2024 Acta Scientific, All rights reserved.