Kailash Nath Agarwal* and Dev Kumari Agarwal
Health Care and Research Association for Adolescents, Noida, India
*Corresponding Author: Kailash Nath Agarwal, Health Care and Research Association for Adolescents, Noida, India.
Received: December 14, 2018; Published: January 22, 2019
Citation: Kailash Nath Agarwal and Dev Kumari Agarwal. “Impact of Maternal and Early Life Undernutrition/Anemia on Mental Functions”. Acta Scientific Paediatrics 2.2 (2019):08-14.
Malnutrition refers to deficiencies, excesses or imbalances in intake of energy, protein and/or other nutrients and refers to both under nutrition and over nutrition. New classification scheme proposed by American Society for Parenteral and Enteral Nutrition incorporates chronicity, etiology, mechanisms of nutrient imbalance, severity of malnutrition and its impact on outcomes. In growing economies both under nutrition as well as over nutrition are observed with associated health consequences.
Intrauterine and early life under nutrition result in impairment of growth and development, intelligence, behavioral, conceptual and sensory motor development in preschool years. A child is stunted if the body is proportionate yet when compared to a normal child of the same age, he/she is shorter. In a wasted child, body fat and muscle reserves are broken down to maintain essential functions leading to weight loss. A child who is stunted and wasted is both short and thin compared to that of a normal child. Malnutrition in childhood affects IQ, cognitive function, persistence of soft neurological signs and affects higher-order thinking skills in adolescents. The changes that occur early in iron deficiency/anemia (pregnancy anemia in Bangladesh 77% and India 86%)) may account for much of the long-term impact on decreased cognitive abilities. As anemia or iron deficiency affect brain iron content and neurotransmitters, irreversibly.
Keywords: Malnutrition; Definition; Maternal; Low Birth Weight; Intrauterine Growth Retardation; Child; Stunted; Wasted; Anemia; Iron Deficiency; Brain Development
The World Bank estimates that India has highest number of children suffering from malnutrition in the world. The prevalence of underweight children in India is among the highest in the world, and is nearly double that of Subsaharan Africa with dire consequences for morbidity like retardation of physical growth and mental development, mortality, productivity and economic growth. The 2015 Global health Index (GHI) Report [1] ranked India 20th amongst leading countries with a serious hunger situation. Despite of economic growth in India, India’s hunger is still worse than North Korea or Sudan. And a child raised in India is more likely to be malnourished than Somalia. Various studies suggest that the biggest reason for India’s malnutrition is poor sanitation, polluted water, unclean vegetables, adulteration and illiteracy. Because of poor sanitation situation, more children in India than North Korea, Sudan and Somalia are exposed to bacteria. The bacteria sicken them, and make it hard for children to consume nutrients, which results in malnutrition. 620 million people in India don’t have a toilet in their house and they use public toilet or defecate in fields or any open space (Prime Minister of India has initiated a national programmed “Swatch Bharat” to meet the much needed in sanitation). In addition, the air quality in India is among the worst in the world. UNICEF is also recognizing the poor sanitation as one of the reasons for malnutrition. In addition, cost of food, no easy affordability of pulses (source of protein for vegetarians) and vegetables/ fruits make it worse. Women who suffer malnutrition are less likely to have healthy babies. Further they generally lack proper knowledge in nurturing/feeding children. Consequently, newborns/infants in early life are unable to get adequate amount of nutrition from their mothers.
According to the World Health Organization [2], malnutrition refers to deficiencies, excesses or imbalances in intakes of energy, protein and/or other nutrients.
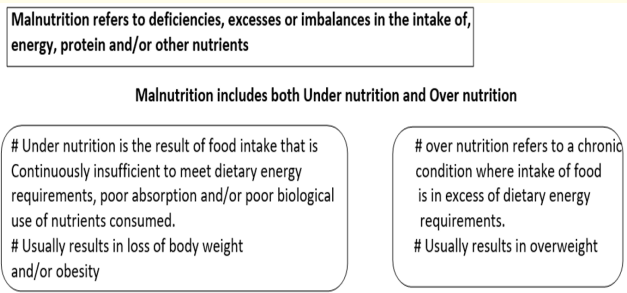
Figure a: DWHO. WHO Child Growth Standards.
Contrary to the common usage, the term ‘malnutrition’ correctly includes both under nutrition and over nutrition.
New classification scheme incorporates chronicity, etiology, mechanisms of nutrient imbalance, severity of malnutrition, and its impact on outcomes. Based on its etiology, malnutrition is either:
‘Pediatric malnutrition (under nutrition) is defined as an imbalance between nutrient requirements and the intake that results in cumulative deficits of energy, protein, or micronutrients that may negatively affect growth, development and other relevant outcomes’.
India with surplus food continues to see malnutrition: manifesting as stunting, wasting, underweight and anemia. Unfortunately, these indices are on a rise as observed in National Family Health Surveys (NFHS) II vs III. According to the 2011 Hunger and Malnutrition survey conducted by the Nandi Foundation, 42 percent of Indian children under five years old are underweight - almost double the rate of sub-Saharan Africa. This is in spite of the fact that today India is one of the major food producers in the world. The food sector contributes to about 18% of India’s GDP.
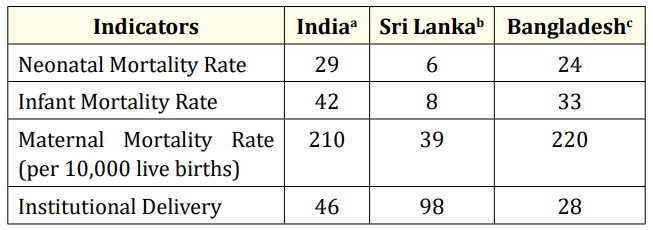
Table a: It is estimated that 67,000 women die of puerperal causes each year in Indiad
a. UNICEF, UNICEF - India - Statistics, 2014. Available at: http:// www.unicef.org/infoby country /india_statistics.html.
b. UNICEF, UNICEF - Srilanka - Statistics, 2014. Available at: http:// www.unicef.org/infoby country /sri_lank a_statistics.html.
3c UNICEF, UNICEF - Bangladesh - Statistics, 2014. Available at: http://www.unicef.org/infoby country /bangladesh_bangladesh_ statistics.html.
d. Bhowmik S. Child mortality: Will India achieve the 2015 target? BMJ. 2013;346:1502.
We will discuss community-based case studies, which outline the importance of maternal nutrition on maternal health and child outcome [5].
In the case study– 1 the impact of maternal under nutrition can be observed from a prospective study conducted in rural setting of eastern Uttar Pradesh, Varanasi. The study evaluated the birth weight pattern in chronic as well as currently undernourished pregnant women. In the study, anthropometry, hemoglobin, dietary intake, birth weight, fundal height and abdominal girth data of 3700 eligible pregnant women at 16 ± 2, 28 ± 2 and 36 ± 2 weeks of gestation were recorded. Outcome measure was birth weight pattern of newborns.
Results indicated that out of 3700 births, 34.6% were of low birth weight and only 8.2% weighed more than 3000 g. Fundal height was <24.5 cm at 28 weeks of gestation (1368 women) and was associated with higher low-birth-weight deliveries. Fundal height did not increase during 35-39 weeks of gestation (was lower by 5 cm as compared to normal).
With respect to the maternal weight gain, women in later pregnancy (during 35 - 43 weeks of gestation), showed weekly weight gain of 15 - 53 g, only. In contrast, healthy women gained 400 g/ week in the second and third trimesters. Total weight gained during the entire period of pregnancy was about 6 kg only, whereas ideally the gain should be between 13 and 18 kg [5].
For understanding the importance of nutrition in pregnancy, it is useful to additionally note the data of World War II-famine in Leningrad (USSR) where women were already undernourished. About 50% of the children who were born were low birth weight (LBW) and birth weight fell by 530g. In contrast, during the Dutch famine, only 9% of the infants born to previously well-nourished Dutch women had LBW and birth weight fell by 327g. The Dutch famine was imposed on a previously well-nourished population and the official daily food for the general adult population gradually decreased from 1800 calories in December 1943 to 1400 calories in October 1944 to below 1000 calories in the late November 1944. December 1944 to April 1945 was the peak of the famine during which the official daily ration fell abruptly to about 400800 calories. Even though pregnant and lactating women had extra food during the famine, these extra supplies could no longer be provided at the height of the famine. What is unique about Dutch Famine is that it was imposed on a previously well-nourished population [6].
These two historical examples illustrate the importance of prepregnancy nutrition and its impact on pregnancy outcome.
Let us now look at the community-based case study - 2.
We will discuss the impact of ICDS (Integrated Child Development Services) program on maternal nutrition and birth weight in rural Varanasi [7]. India’s ICDS (nutrition + education + child care program) has been adapted from the Women Infants and Children (WIC) in USA.
5289 pregnancies were registered during 1987-1993. All live births were seen within 48 hr and their weight was recorded.
The ICDS-supplemented mothers gained 100 g more in pregnancy, birth weight increased by 58 g, preterm’s and low birth weights reduced by 12.9% and 29.4%, respectively, as compared to the un supplemented mothers (ICDS). In the un supplemented ICDS area, preterm and low-birth-weight births reduced by 44.2% and 22.4%, respectively, as compared to non-ICDS area pregnancies. The un supplemented (ICDS) had higher birth weight by 25 g as compared to the non-ICDS. There were 16.2%, 11.0% and 12.9% having birth weight over 3000 g in these three areas, respectively. The multiple regression analysis showed that the increased weight gain in pregnancy, length of gestation, caloric intake and term hemoglobin were significantly associated with birth weight.
Thus, nutritional supplementation can benefit undernourished pregnant women and lead to better maternal and fetal outcomes.
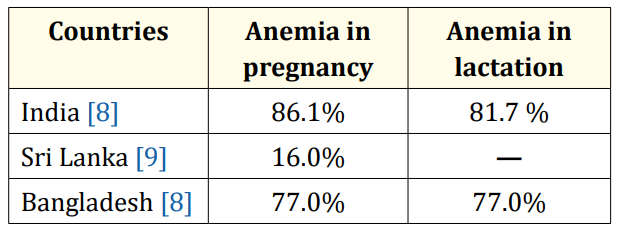
Table 1: Prevalence of anemia in India, Srilanka and Bangladesh.
In maternal anemia, fetal liver iron is low resulting in earlyonset anemia. There is an increased gradient in the presence of maternal iron deficiency for transport of iron from mother to fetus but the transport remains proportionate to the degree of maternal hypoferremia. Fetal Liver iron stores are reduced significantly in maternal hypoferremia, and fetal brain iron content and neurotransmitters are reduced irreversibly, and their receptors are altered [10].
Maternal suboptimal nutrition during pregnancy results in Infants born with IUGR (Intra Uterine Growth Retardation-Birth weight less than 10th centile for gestational age) are at an increased risk of prenatal morbidity and mortality [11,12]. Furthermore, when compared to infants with appropriate intrauterine growth, infants with IUGR have greater rates of physical (Stunting), neurological and mental impairment [13]. Globally, about 30 million infants suffer from IUGR every year, and nearly 75% of all affected infants are born in Asia [13].
Low birth-weight infants are at an increased risk of morbidity, impaired mental development and mortality. The risk of neonatal death is reported to be four times higher in infants who weigh 2000-2499 g at birth when compared to those who weigh 25003499 g. The greater the severity of growth restriction within the low birth-weight category, the higher the risk of mortality [14].
Low birth weight is a strong predictor of size in later life since infants born with IUGR seldom catch-up to normal size during childhood [3]. Low birth weight increases the risk for development of adult metabolic syndrome. Low-birth-weight babies have an increased risk of later life diseases such as coronary heart disease, hypertension, type 2 diabetes and other chronic diseases [15-18].
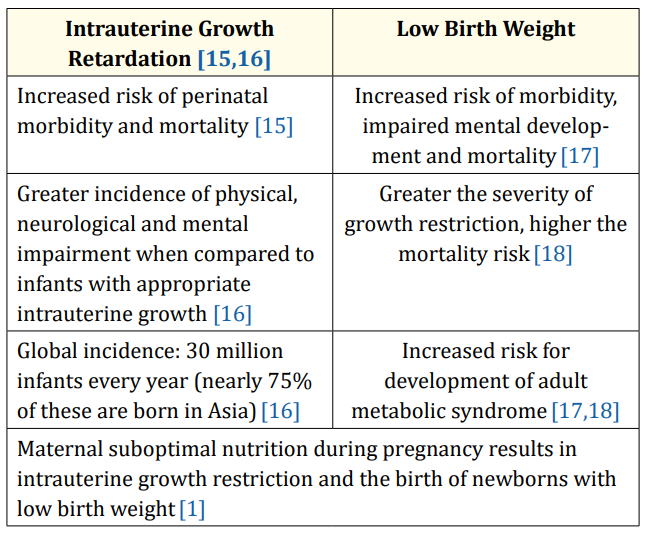
Table b
India and Bangladesh have the highest proportion of children who are underweight. In India, 20% of children are wasted (Table 2). National Family Health Survey in India indicated that 1 in 6 children aged between 38 and 57 months are wasted. It is encouraging to note that the corresponding figures in Sri Lanka are on the lower side [11,12].
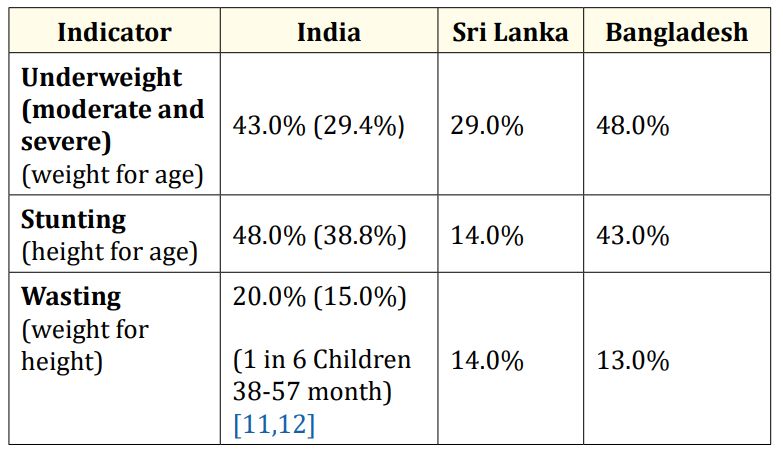
Table 2: Underweight, stunted and wasted children in India, Sri Lanka and Bangladesh.
In parenthesis recent “Rapid survey on children”, UNICEF and Government of India figures are given 2015.
An underweight child has a weight-for-age Z-score that is at least 2 SD below the median for the National Child Growth Standards. This condition can result from either chronic or acute malnutrition, or both.
A stunted child has a height-for-age Z-score that is at least 2 standard deviations (SD) below the median for the National Child Growth Standards. Chronic malnutrition is an indicator of linear growth retardation that results from failure to receive adequate nutrition over a long period and may be exacerbated by recurrent and chronic illness [14]. These chronic malnourished have serious health consequences i.e. short stature with poor strength and structural and functional brain damage.
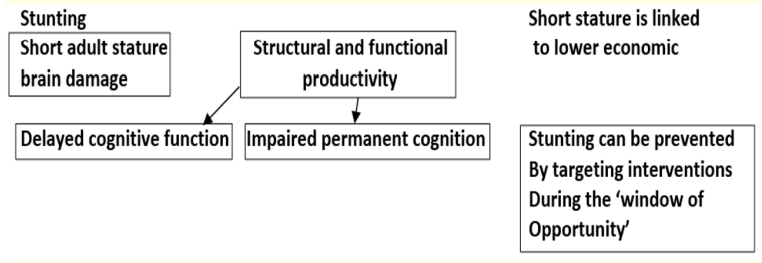
Figure b
Evidence from developing countries indicates that being stunted between 12 and 36 months of age is associated with poorer cognitive performance and lower school achievement in middle childhood.
A wasted child has a weight-for-height Z-score that is at least 2 SD below the median for the National Child Growth Standards. Wasting represents a recent failure to receive adequate nutrition and may be affected by recent episodes of diarrhea and other acute illnesses.
The intrauterine growth retarded offspring of undernourished mothers [19,20]:
Neonatal Period: Infants with cord serum ferritin concentrations < 35 mcg/L have abnormal auditory recognition memory, infants do not discriminate a familiar stimulus (e.g. maternal voice) from a stranger’s voice [31].
Studies in children 8-12 years of age having anemia (nutritional, serum ferritin < 20ng) or due to thalassemia (serum ferritin > 1000ng), on brain MRI spectroscopy showed similar iron content in globus pallidus, caudate and dentate nucleus in both the conditions. There was an increase in creatinine and aspartate and reduction in choline concentration. Such changes are also observed in Hutington’s chorea and Alzeimher’s disease. Reduction of choline, in latent iron deficiency is a significant effect. Choline is synthesized in the brain in very small amounts; its uptake is Na+ dependent, which requires oxygen.
Dietary iron depletion IN PREGNANT RATS- reduced fetal hepatic iron and selectively brain iron content.
In Cerebral cortex 17%, Cerebellum 18%, Hypothalamus 19%,
Mid brain 21%, and Corpus striatum 32%
Low brain “Fe” content was associated with significant alteration in brain Cu, Zn, Ca, Mn, Pb and Cd levels.
The neurotransmitter changes were specific to “Fe” deficiency as in under nutrition these get corrected partially or completely on rehabilitation [35].
Iron is essential for myelination - the process by which the brain produces a fatty insulation around the nerves. Iron has clear effects on the function of dopamine and probably serotonin, two brain chemicals that help send and receive signals (neurotransmitters) and have many roles in the brain.
Copyright: © 2019 Kailash Nath Agarwal and Dev Kumari Agarwal. This is an open-access article distributed under the terms of the Creative Commons Attribution License, which permits unrestricted use, distribution, and reproduction in any medium, provided the original author and source are credited.


 Open Access by
Acta Scientific is licensed under a Creative Commons Attribution 4.0 International License
Open Access by
Acta Scientific is licensed under a Creative Commons Attribution 4.0 International License
Based on a work at https://actascientific.com
ff
ff
© 2024 Acta Scientific, All rights reserved.