Pele GI1*, Bolade MK2, Enujiugha VN2, Sanni DM3 and Ogunsua AO4
1Department of Human Nutrition and Dietetics, Federal University of Health Sciences, Ila- Orangun, Osun State, Nigeria
2Department of Food Science and Technology, Federal University of Technology, Akure, Ondo State, Nigeria
3Department of Biochemistry, Federal University of Technology, Akure, Ondo State, Nigeria
4Department of Food Science and Technology, Joseph Ayo Babalola University,
Ikeji-Arakeji, Osun State, Nigeria
*Corresponding Author: Pele GI, Department of Human Nutrition and Dietetics, Federal University of Health Sciences, Ila- Orangun, Osun State, Nigeria.
Received: May 20, 2024; Published: August 29, 2024
Citation: Pele GI., et al. “Predictive Model of the Saccharification Steps of Cassava Starch Hydrolysis by Amiloglucosidase using a Statistical Approach". Acta Scientific Nutritional Health 8.9 (2024): 82-87.
Saccharification is a complex biochemical process that involves breakage of glycosidic bonds of starch into its constituents. Statistical approach was used to optimize the saccharification steps of cassava starch hydrolysis by amiloglucosidase. The optimum condition of cassava starch hydrolysis was determined using pure culture of a thermostable amiloglucosidase for saccharification, and the activity of the enzyme determined at varying pH, temperature and time. A 3 x 3 x 12 completely randomized experimental design comprising of 3 pH values (pH 4.0, 4.5and 5.0); 3 temperatures (50, 55 and 60 oC) and 12 time ranges (6, 12, 18, 24, 30, 36, 42, 48, 54, 60, 66 and 72 h) were employed for saccharification and the data obtained were subjected to multiple regression and the degree of correlation evaluated. The results showed that the p-values of the model terms for sample dry weight, reducing sugar and dextrose equivalent were significant (p < 0.05), however the R2 which was found to be 94.5% for sample dry weight; 85.4% for reducing sugar and 89.8% for dextrose equivalent proved suitable for adequate representation of the actual relationship between the selected variables. The optimal reducing sugar and dextrose equivalent were 74.23% and 96.41 DE, respectively at pH 4.5, 55 °C and 72 h. The model established the actual relationship between the actual variables of the saccharification and the predictable values of the process while the glucose obtained from the optimized process may serve as a substrate to initiate isomerization process in the production of fructose syrup.
Keywords: Saccharification; Amiloglucosidase; Reducing Sugar; Dextrose Equivalent; Sample Dry Weight
Starch hydrolysis is the process of breaking down complex molecules of starch compound into its simplest form of monosaccharides, usually glucose [1]. It is traditionally done by mineral acid catalysis, but biotechnological advances have led to the use of enzymes that now allow the controlled production of a variety of glucose and glucose-based products such as maltodextrins [2]. Essentially, four groups of enzymes are involved in the hydrolysis of starch. The endo-amylase and exo-amylase that have activity primarily on the ά-1, 4 linkage and the enzyme that act exclusively on the ά-1, 6 linkage, respectively [3]. A third group, the isomerases, act on glucose to transform it to fructose. Finally, the cyclodextrin glycosyl transferase group degrades starch by catalyzing cyclization and disproportionation reactions [4]. The utilization of glucose syrup of high industrial standard cannot be over emphasised in the food and pharmaceutical industries. Glucose, an important industrial product of starch hydrolysis finds application as bulk sweetener in the food [5], pharmaceutical [6] and confectionary industries [7]. The production of glucose, maltose and dextrins from starch sources such as maize [1,3], plantain [8], banana [4], cassava [9] and sweet potato [10] have been practised and well documented in many parts of the world. However, production of these important products of starch hydrolysis in Nigeria has been largely obtained from starch of tubers such as cassava whose cultivation is in large scale in the southern part of the country [11]. Amyglucosidase is an exoenzyme which removes glucose units in a consecutive manner from the non-reducing end of the substrate chain. The product formed is glucose only, and this differentiates it from amylases [12]. In addition to hydrolysing α 1-4 linkages, this enzymes can also attack α 1-6 linkages at the branch point [13]. However, it has been shown that malted sorghum and barley contained significant amounts of β amylase which was absent in the ingeminated grains [14]. Cassava is a perennial woody shrub and its root is another good source of glucose production [15]. It is a cheap substrate that is easily available in tropical countries. It can be grown in the land with 0-250 meter above the sea level and the minimum annual rainfall of 1,000 mm [16]. Besides, it has high tolerance to drought because it can survive even during the dry season when soil moisture is low and humidity is high. Also, it can survive low soil quality or nutrient as it thrives better in poor soils than any other major food plant [17]. An important role of cassava roots is that it is an energy store for plant’s growth. The energy is preserved in a form of carbohydrate, mainly as starch, which is the greatest component of dry matter in fresh roots [18]. The objective of the present study therefore is to model the saccharification steps of cassava starch hydrolysis by amyloglucosidase using a statistical approach.
Maltodextrin which has an optimal reducing sugar and dextrose equivalent of 17.84% and 14.74 DE, respectively at pH 6.5, 70oC and 60 min was obtained from previously liquefaction process of cassava starch by alpha-amylase [19]. Pure culture of thermostable amyloglucosidase (from Aspergillus Niger; pH 4.5; temperature, 60oC) was obtained from Federal Institute of Industrial Research, Oshodi (FIIRO), Nigeria. Rochelle salt and Dinitrosalicylic acid (DNS) was obtained from Pascal Store, Akure, Nigeria.
A prototype of a fermentor was designed and fabricated to combine with thermostatic water bath (DK-600 SANFA Electrical thermostatic water bath boiler model) for liquefaction and saccharification as shown in figure 1. The fermentor uses variable motor Gear: GIFA Transmission Bologna Italy, Type (TIPO): (Var 10/0) Code (Condice): AC3999 Motor.
The Substrate was produced by preparing a cassava starch suspension of 10% (w/v) with distilled water, to make 10% slurry [19]. Usually 10 g of starch was weighed into 100 ml distilled water to make slurry. The solution of 40 ppm Ca2+ was added for stability of the enzyme. The pH was adjusted to 6.0, 6.5 and 7.0 with Citrate-phosphate buffer, respectively. Gelatinization was done by heating the mixture to 97°C and was held at this temperature for 10 min. The gelatinized starch was cooled to 65, 70 and 75°C, respectively. Liquefaction was carried out by adding 2% (w/v) of alpha-amylase for 40, 50 and 60 min at the temperatures, respectively. The fermentor was clamped with the thermostatic water-bath to maintain at 50 rpm; samples were however withdrawn at regular time intervals to follow the kinetics. The enzyme activity was stopped by heating the mixture to 97°C for 15 to 20 min and centrifuged (80-2 Centrifuge Med-Lab Scientific Company England) at 2500 rpm for 10 min to obtain the supernatant. The procedures described above were done in triplicates; standard curve of glucose production was prepared to determine the optimum condition of liquefaction for cassava starch which is used as the substrate for saccharification process.
The optimum condition of cassava starch hydrolysis was determined using pure culture of thermostable amyloglucosidase for saccharification. The activity of the enzyme was determined at varying pH, temperature and time. A 3 x 3 x 12 completely randomized experimental design comprising of 3 pH values (pH 4.0, 4.5and 5.0); 3 temperatures (50, 55 and 60oC) and 12 time ranges (6, 12, 18, 24, 30, 36, 42, 48, 54, 60, 66 and 72 h) were employed for saccharification.
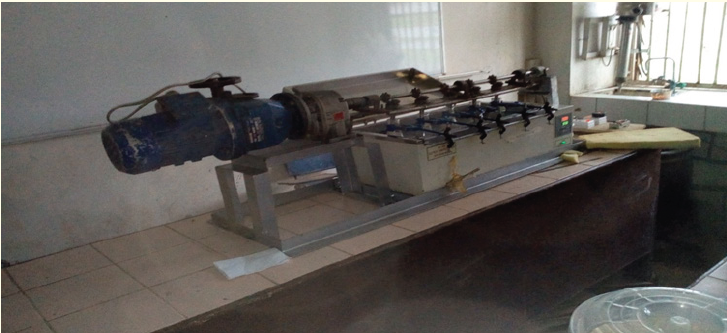
Figure 1: The fermentor used for liquefaction and saccharification.
Note: (Motor) Kw: 0.75; Poles: 4; Rpm min–rpm max:
350-1750; Type: mas 20P; Code: 29602117; Mount
POS: 2.5.4. Bonfiglioli Riduttori, Italy.
The optimum samples from the liquefaction process above were brought down to temperatures of 50, 55 and 60oC and adjusted to pH values of 4.0, 4.5 and 5.0 with diluted hydrochloric acid, respectively. Saccharification process was carried out by adding 2% (w/v) of amyloglucosidase and reaction periods 6, 12, 18, 24, 30, 36, 42, 48, 54, 60, 66, and 72h were allowed at the temperatures and pH values, respectively. The fermentor was also clamped with the thermostatic water-bath to maintain at 50 rpm; samples were withdrawn at regular intervals. The enzyme activity was stopped by heating the mixture to 97oC for 15 to 20 min and centrifuged at 2500 rpm to obtain the supernatant for analyses. The procedures described above were done in triplicates; standard curve of glucose production was prepared to determine the optimum condition of saccharification for cassava starch hydrolysis.
The reducing sugar content of the syrup samples was determined by DNS method described by Miller (1972) [20] with the addition of Rochelle salt. The reducing sugar was determined by adding 3 ml of DNS solution to 1ml of hydrolysed starch (supernatant) in a test tube and boiled for 10 min. This was allowed to cool partially and 1 ml of Rochelle salt was added, while this was allowed to completely cool down before the intensity or absorbance of the red coloured solution was read at 540 nm using UV-Visible Spectrophotometer (AJ-1C03). Series of standard glucose (0 – 500mg/l) were run and a standard graph was plotted to calculate the reducing sugar. Percentage reducing sugar was calculated by the percentage of the ratio of the amount of reducing sugar in the glucose syrup to the amount of starch slurry for the hydrolysis.
Two (2) grams of each of the samples was weighed out with the aid of an analytical balance into dried, cooled and weighed dish in each case. The samples in the dishes were then put into a Genlab moisture extraction oven set at 105⁰C and allowed to dry for 3h after which the samples were then transferred into a dessicator with the aid of a laboratory tong and then allowed to cool for 30 minutes. After cooling in the dessicator, they were weighed again and their respective weights recorded accordingly. The above processes were repeated for each sample until a constant weight was obtained in each case. The difference in weight was calculated as the sample dry weight [21].
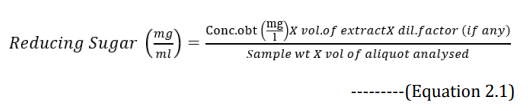
Dextrose equivalent (DE) was determined by the expression described by Betiku et al. (2013) [22]. Dextrose equivalent was calculated as the ratio of reducing sugar expressed as glucose to the sample dry weight.

The statistical results were studied using SPSS20 program. Where the double regression of the variables was studied using ANOVA, in addition to studying the effect of the fixed variable on other variables.
The regression models of the effect of pH, temperature and time on the saccharification steps of cassava hydrolysis are shown on figures 2a, b and c. The graph established the regression equation and fitness of the plot of the residual value on the vertical axis and fitted value on the horizontal axis, Percentage reducing sugar showed a strong correlation between the model’s predictions and its actual results; the plots are observed to be evenly distributed vertically and the residual plots are randomly dispersed around the horizontal axis, though pH are not significant (p > 0.05), the coefficient of determination of the model showed that a unit increase in pH will increase the percentage reducing sugar by 102%; a unit increase in temperature will increase the reducing sugar by 107% while a unit increase in time will increase the reducing sugar by 61.5%. Sample dry weight also showed a strong correlation between the model’s prediction and its actual results.
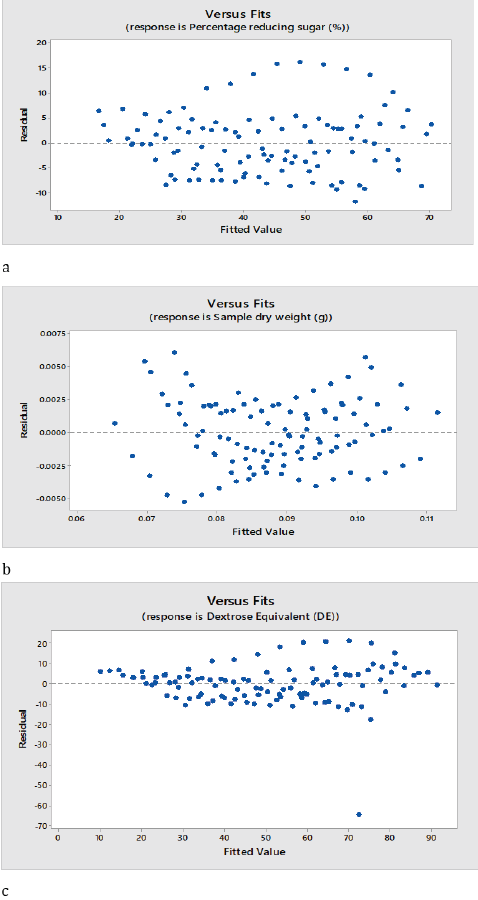
Figure 2: Fit regression model of saccharification of cassava starch.
a: Reducing sugar; b: Sample dry weight; c: Dextrose equivalent
The plots are observed to be pretty symmetrically distributed; the points in a residual plot are randomly dispersed around the horizontal axis where a linear regression model coefficient of determination is established. A unit increase in pH will reduce the sample dry weight by 1%; a unit increase in temperature will reduce sample dry weight by 0.09% and a unit increase in time will reduce the sample dry weight by 0.04%. A strong correlation between the model’s predictions and actual results was also observed in dextrose equivalent, the plots are evenly distributed vertically and the residual plots are randomly dispersed around the horizontal axis, however a linear model coefficient of determination showed that a unit increase in pH will increase the dextrose equivalent by 783%; a unit increase in temperature will also increase dextrose equivalent by 182% while a unit increase in time will increase the dextrose equivalent by 93.6%. Evaluation and determination of the coefficient of the full regression model equation and the statistical significance of saccharification steps of cassava hydrolysis are presented in table 1. The results revealed that the p-values of the model terms for sample dry weight, reducing sugar and dextrose equivalent were significant (p < 0.05). table 2 shows the analysis of variance of the regression equation model, the model fisher F-test of sample dry weight, 595.65; reducing sugar, 204.79; dextrose equivalent, 309.27 with high probability values [(pmodel > F) = 0.000] demonstrated a high significance of the regression model as reported by Kunammeni and Singh (2005) [23]. The goodness of fit was checked by the coefficient of determination (R2), such that Guan and Yao (2008) [24] reported that R2 should be at least 0.80 for the good fit of a model, however for the saccharification steps, the R2 was found to be 94.5% for sample dry weight, 85.4% for reducing sugar and 89.8% for dextrose equivalent. However, while R2 adjusted was found to be 94.3% for sample dry weight, 85.0% for reducing sugar and 89.5% for dextrose equivalent, the models of sample dry weight, reducing sugar and dextrose equivalent proved suitable for adequate representation of the actual relationship between the selected variables [25]. The final regression equation in terms of coded factors for the response surface quadratic model for the saccharification steps is described in Equation 3.1-3.3.
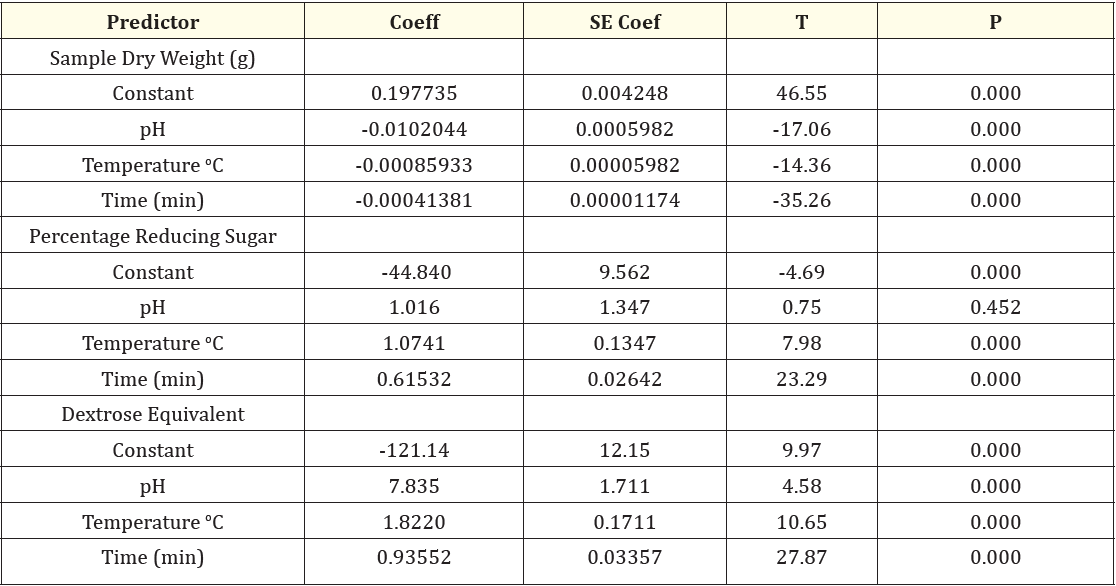
Table 1: Test of Significance of Every Regression Coefficient for the Saccharification Steps of Cassava Hydrolysis.
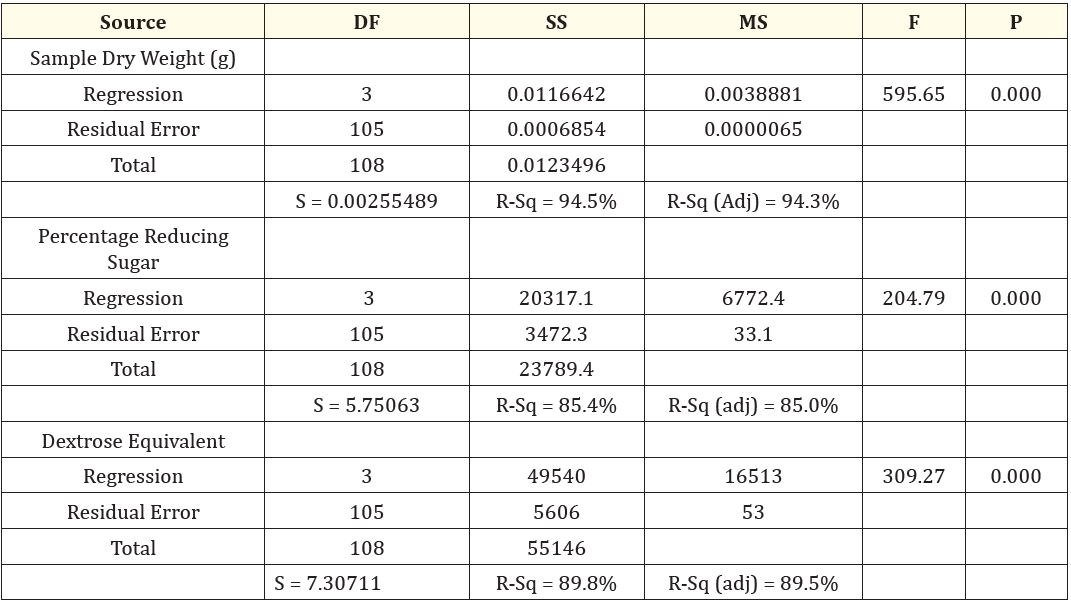
Table 2: Analysis of Variance (ANOVA) of the Regression Equation for the Saccharification Steps of Cassava Hydrolysis.
Sample Dry Weight = 0.198 - 0.0102 pH - 0.000859 Temperature (⁰C)
- 0.000414 Time (h)………………………………………………………………………… Equation 3.1
Percentage reducing sugar = - 44.8 + 1.02 pH + 1.07 Temperature (⁰C)
+ 0.615 Time (h)……………………………………………,,,,,,,,,,,,,,,,,,,,,,,,,,,,,,,,,,,,,,, Equation 3.2
Dextrose Equivalent = - 121 + 7.83 pH + 1.82 Temperature (⁰C) + 0.936 Time (h)…................... Equation 3.3
Predictive model of the saccharification steps of cassava starch hydrolysis by amiloglucosidase using a statistical approach has been unraveled. The model terms of sample dry weight, reducing sugar and dextrose equivalent were significant (p < 0.05), however the R2 for sample dry weight which was found to be 94.5% was found suitable for adequate representation of the actual relationship between the selected variables. The results also showed that R2 for reducing sugar and dextrose equivalent were 85.4% and 89.8%, respectively were strong for adequate representation of the actual relationship while the model terms were significant. The optimal reducing sugar and dextrose equivalent were 74.23% and 96.41 DE, respectively at pH 4.5, 55 °C and 72h. The model established the actual relationship between the actual variables of the saccharification and the predictable values of the process while the glucose obtained from the optimized process may serve as a substrate to initiate isomerization process in the production of fructose syrup
Copyright: © 2024 Pele GI., et al. This is an open-access article distributed under the terms of the Creative Commons Attribution License, which permits unrestricted use, distribution, and reproduction in any medium, provided the original author and source are credited.
 Open Access by
Acta Scientific is licensed under a Creative Commons Attribution 4.0 International License
Open Access by
Acta Scientific is licensed under a Creative Commons Attribution 4.0 International License
Based on a work at https://actascientific.com
ff


