Ranjit Shaw1, Md. Zishan Ansari2 and Radha Chaube3*
1Department of Biosciences and Bioengineering, IIT Bombay, Powai, Mumbai, Maharashtra, India
2Department of Biotechnology, School of Studies of Interdisciplinary Education and Research, Guru Ghasidas Vishwavidyalaya (A Central University), Koni, Bilaspur, (C.G.), India
3Department of Zoology, Institute of Science, Banaras Hindu University, Varanasi, Uttar Pradesh, India
*Corresponding Author: Radha Chaube, Department of Zoology, Institute of Science, Banaras Hindu University, Varanasi, Uttar Pradesh, India.
Received: September 04, 2024; Published: September 30, 2024
Citation: Radha Chaube., et al. “Computational Three-Dimensional Modelling of the β-Subunit of Follicle-Stimulating Hormone in Stinging Catfish (Heteropneustes fossilis)”. Acta Scientific Veterinary Sciences 6.10 (2024): 52-61.
The stinging catfish (Heteropneustes fossilis) is an important aquaculture species, which plays a pivotal role in the global fishing industry due to its rapid growth rates and high nutritional value. It is an excellent model for genomic studies due to high levels of biological conservation and fecundity rate. Follicle-stimulating hormone (FSH) is a key regulator of reproductive processes in vertebrates, including catfish. It stimulates the growth and maturation of ovarian follicles in females and spermatogenesis in males. Despite its significance, its three-dimensional (3-D) structure is not found in the Protein Data Bank. To bridge this gap, we retrieved the protein sequence of the β-subunit of the FSH of H. fossilis from NCBI. The preliminary 3-D structure was generated by automated homology modeling using SWISS MODEL. This model was further refined through energy minimization using KoBaMIN. The Ramachandran plots were obtained from the RAMPAGE server. The sequences from three other model organisms, Mus musculus, Columba livia, and Homo sapiens, retrieved from NCBI, were used for a comparative physicochemical characterization using ProtParam. The functional regions were predicted using the Vector Alignment Search Tool. Finally, Hydrophobic Cluster Analysis was conducted to assess hydrophobicity patterns within the structure. A first attempt to model the 3-D structure of FSH of H. fossilis reveals that it consists of a single peptide chain and two pairs of anti-parallel β-sheets and loops. Our research has practical applications in developing targeted breeding programs and hormonal therapies to enhance reproductive efficiency in catfish aquaculture.
Keywords: Heteropneustes fossilis; Follicle-Stimulating Hormone; Protein Data Bank; Homology Modelling; Catfish Aquaculture
Heteropneustes fossilis, commonly known as the stinging catfish, is a freshwater species native to South Asia [1]. It has a predominant presence in India, Bangladesh, and Pakistan. It is renowned for its adaptability to adverse environmental conditions [2]. It lives in the muddy bottoms of weed-filled swamps and feeds on the abundant benthic fauna and detritus of decaying organic matter [3]. Economically, it plays a role in local fisheries due to its hardiness and nutritional value [4]. It has a very high level of diversity compared to other lower and higher organisms [5]. Opposed to known practices such as carp culture and tilapia culture, catfish culture has yet to become popular [6]. It has numerous advantages over the former [7]. The culture of H. fossilis can be a promising alternative for farmers since they grow very fast [8].
Follicle-stimulating hormone (FSH) is a key disulfide-rich heteromeric glycoprotein consisting of a common alpha and a hormone-specific beta subunit [9]. These subunits are noncovalently linked with each other. It is secreted by the pituitary gland and regulates gonadal development and maturation [10]. It acts through a G-protein-coupled receptor on the surface of target cells to stimulate testicular and ovarian functions [11,12]. In females, it induces the maturation of ovarian follicles by targeting the follicle-stimulating hormone receptor (FSHR) expressed exclusively on granulosa cells [13,14].
Research so far on FSH of H. fossilis has primarily focused on its physiological roles and expression patterns within the reproductive cycle [15]. Studies have examined how FSH levels fluctuate in response to environmental and endogenous factors [16,17]. Techniques such as immunoassays and gene expression analysis have been used to study FSH activity and its genetic regulation [18,19]. However, such studies have largely been limited to the biochemical and physiological aspects of FSH [20,21]. The structural characterization of the FSH in H. fossilis has remained relatively unexplored. This lack of structural data is particularly evident in the Protein Data Bank (PDB), where no entries exist for the FSH of H. fossilis [22,23].
H. fossilis is an excellent model for genomic studies due to high levels of biological conservation and fecundity rate [24-26]. There has been rapid progress in fish genomic research due to low-cost sequencing platforms and the use of advanced computational tools for data analysis [27-30]. The absence of detailed structural information on FSH in H. fossilis represents a significant gap in the current fish genomic research [31,32]. Thus, the primary objective of our present study is to model the 3-D structure of the β-subunit of FSH in H. fossilis using advanced computational tools and techniques, including sequence retrieval [33], homology modeling [34], energy minimization [35], physicochemical characterization [36], structural alignment [37], functional region prediction [38], and hydrophobic cluster analysis [39].
The ultimate goal of FSH modeling is to predict a structure from its sequence with an accuracy that is comparable to the best results achieved experimentally. This would allow us to safely use rapidly generated in silico protein models in all contexts. Protein modeling is the only way to obtain structural information if experimental techniques fail. Many proteins are simply too large for NMR analysis and cannot be crystallized for X-ray diffraction [40]. The successful prediction and validation of the FSH structure will fill a critical knowledge gap and provide a foundation for future experimental studies.
The study design is depicted in the form of a flowchart in figure 1 in sequence.

Figure 1: The flowchart depicting the workflow of the study to model the 3-D structure of the β-subunit of FSH of H. fossilis.
The protein sequence of the β-subunit of the FSH of H. fossilis (Accession ID: ABH20169) was retrieved from NCBI (http://ncbi. nlm.nih.gov/) in FASTA format.
A fully automated homology modeling of the β-subunit of FSH of H. fossilis was performed using SWISS-MODEL (https://swissmodel. expasy.org/). The protein sequence was submitted. Template superposition, target-template alignment, model building, and side-chain modeling were executed sequentially in a fully automated mode. The modelled structure was visualized using UCSF Chimera version 1.17.3 (https://www.cgl.ucsf.edu/chimera/) [26]. QMEAN global scores were also evaluated.
The energy of the original SWISS MODEL structure of the β-subunit of FSH of H. fossilis was minimized using the KoBaMIN server (https://bio.tools/kobamin). The energy-minimized structure was visualized using UCSF Chimera version 1.17.3.
The energy-minimized structure was superimposed on the original SWISS MODEL structure. The RMSD was taken into account to analyze the superimposition. The superimposed structure was visualized using UCSF Chimera version 1.17.3.
The Ramachandran plot [27] was retrieved from the RAMPAGE server [28], and the positions of residues were analyzed for both the original and the energy-minimized structures of the β-subunit of FSH of H. fossilis.
The protein sequences of three other model organisms, namely, Mus musculus, Columba livia, and Homo sapiens, were retrieved from NCBI. These sequences were utilized to compare the physiochemical parameters of the energy-minimized structure of the β-subunit of FSH of H. fossilis using ProtParam (https://web.expasy. org/protparam/).
Structural alignment of the β-subunit of FSH of H. fossilis was achieved using the NCBI Vector Alignment Search Tool (VAST) (https://structure.ncbi.nlm.nih.gov/Structure/VAST/vast.shtml). Further, the functional regions were predicted using the ConSurf server (https://consurf.tau.ac.il/consurf_index.php).
The protein sequence of H. fossilis, M. musculus, C. livia, and H. sapiens was uploaded on the RPBS Web Portal (https://mobyle.rpbs. univ-paris-diderot.fr/cgi-bin/portal.py?form=HCA#forms::HCA). The hydrophobic amino acids were encircled, and their counters were joined. The resulting profile was analyzed manually following the method of [28]. When a 3-D protein structure is provided, the nine-color conservation scores are projected onto the 3-D structure of the query protein. First Glance in Jmol (http://firstglance.jmol. org) is used to visualize the colored protein structure. Scripts for visualizing the protein with ConSurf scores have been generated for several molecular visualization tools, including PyMol (http:// www.pymol.org), Chimera, Jmol (http://www.jmol.org), and RasMol. ConSurf generates several results: a sequence and multiple sequence alignment (MSA) colored by conservation scores, a text file summarizing the normalized score, assigned color, reliability estimation (for the Bayesian method), and the amino acids/ nucleotides in the respective MSA column. Additionally, ConSurf provides the sequences selected for the MSA, the constructed MSA itself, and a file showing the frequency of each amino acid/ nucleotide observed in each MSA column.
The protein sequence of the β-subunit of FSH of H. fossilis (Accession ID: AHB20169), as retrieved from NCBI in FASTA format, is shown below:
>gi|559807285|gb|AHB20169.1| follicle stimulating hormone beta subunit [Heteropneustes fossilis] MRGVAMMLLLPMLVWAGSECKARCRLTGISITVESDECGSCITINTTA CAPGVDSSFTYPVALSCECSQCNTEITDCGAFSMQPSSCHTHAY
It is evident that the sequence length of the β-subunit of FSH of H. fossilis is 132 amino acids.
The Chimera 3-D visualization of the FSH, as shown in figure 2, showed that it consists of a single peptide chain and two pairs of anti-parallel β-sheets and loops in addition.

Figure 2: Chimera 3-D visualization of the homology model of the 3-D structure of the β-subunit of FSH of H. fossilis.
The negative value of the QMEAN4 Z-score suggests that the 3-D structure predicted through homology modeling requires further energy minimization to enhance its quality.
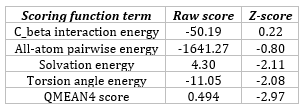
Table 1: QMEAN global scores of the model 3-D structure of the β-subunit of FSH of H. fossilis.
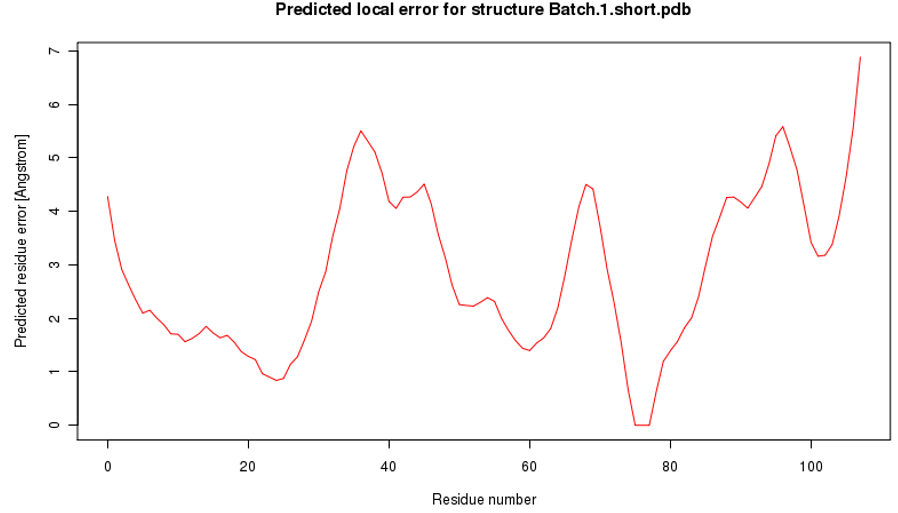
Figure 3: Predicted local error for the 3-D model structure of the β-subunit of FSH of H. fossilis.
The modelled structure was then energy-minimized, and as evident from figure 4, the energy-minimized structure has a different orientation as compared to the originally predicted structure.
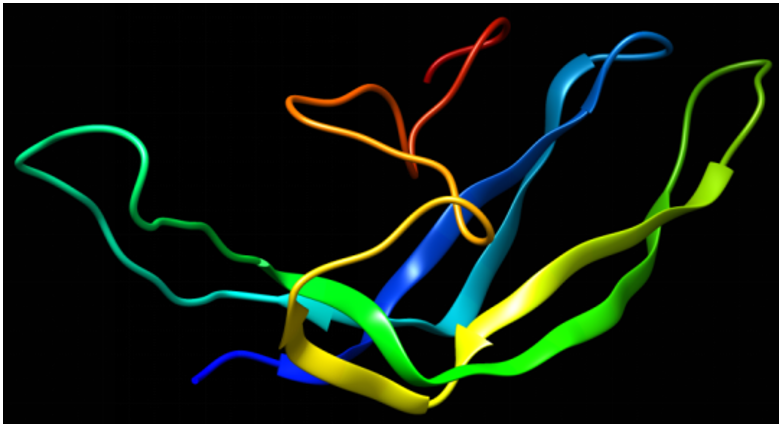
Figure 4: Chimera 3-D visualization of the energy-minimized structure of the β-subunit of FSH of H. fossilis using the KoBaMIN server.
Fig. 5 shows the image obtained after the superimposition of the original structure and the structure generated after the energy minimization step of the beta-subunit of FSH of H. fossilis. Figure 5,6 show that the superimposed structure does not show many differences in the RSMD values. However, slight differences were observed in loop regions as these regions were not completely superimposed.
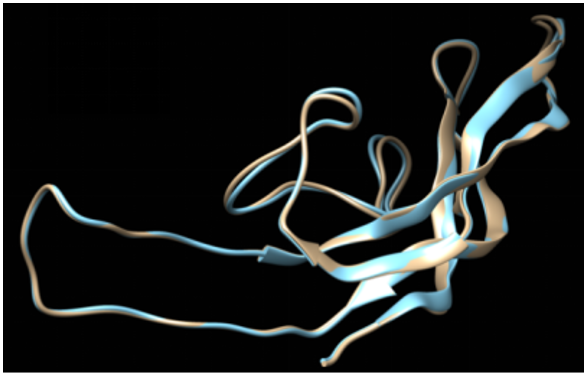
Figure 5: The superimposition of the original and energy-minimized structures of the β-subunit of FSH of H. fossilis.
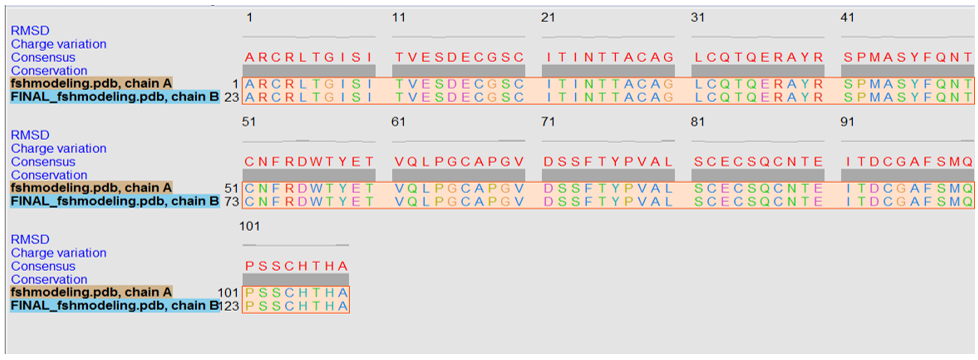
Figure 6: Analysis of the superimposed structure.
From the Ramachandran plots of the original and energyminimized structures (Figure 7,8), it is clear that most of the residues are present in the energetically favored region. Only a minimal number of residues are present in the allowed and outlier regions.
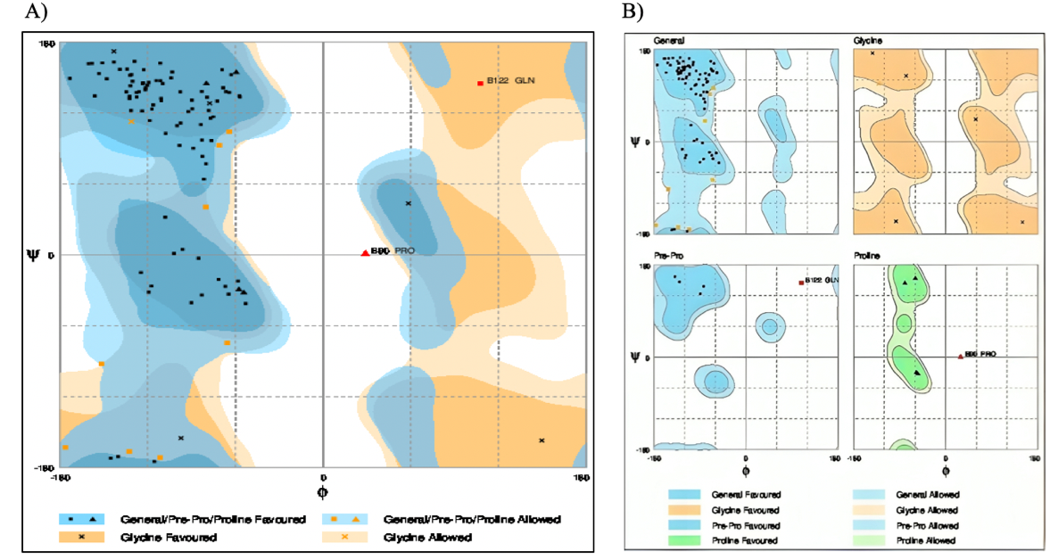
Figure 7: The Ramachandran plot of the original structure of the β-subunit of FSH of H. fossilis.
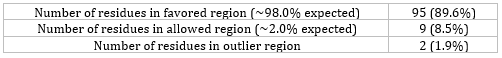
Table 2: Evaluation of residues of the original structure of β-subunit of FSH of H. fossilis.
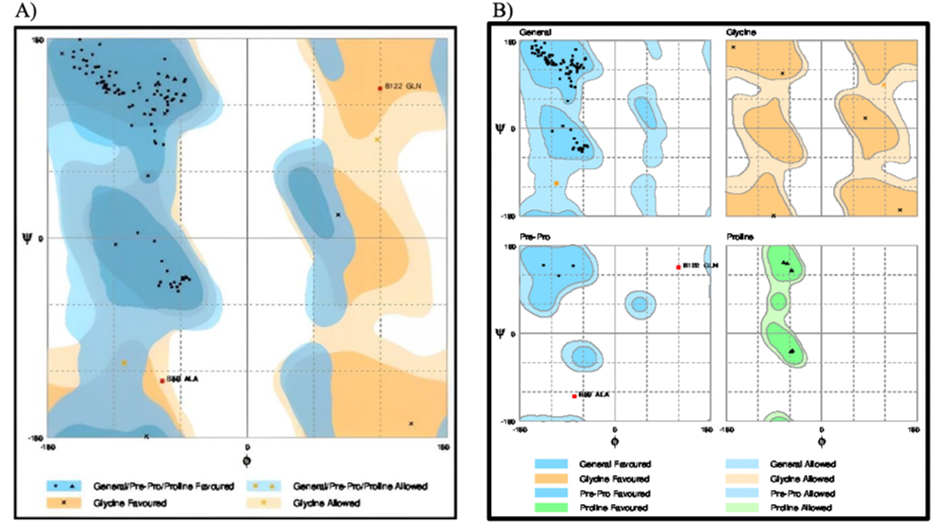
Figure 8: The Ramachandran plot of the energy minimized structure of the β-subunit of FSH of H. fossilis.
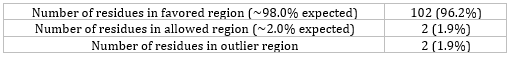
Table 3: Evaluation of residues of the energy-minimized 3-D structure of the β-subunit of FSH of H. fossilis.
From the table below (Table 4), it is clear that the Physicochemical parameters of the β-subunit of FSH of H. fossilis share a high degree of similarity with the sequences from three other model organisms, namely, Mus musculus, Columba livia, and Homo sapiens.
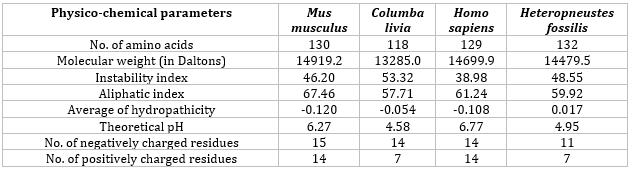
Table 4: Physico-chemical parameters of FSH sequences of four model organisms.
Figure 9 displays the percentage composition of amino acid residues in the β-subunit of FSH of H. fossilis. Additionally, the comparative amino acid residues of the four organisms are shown in figure 10.
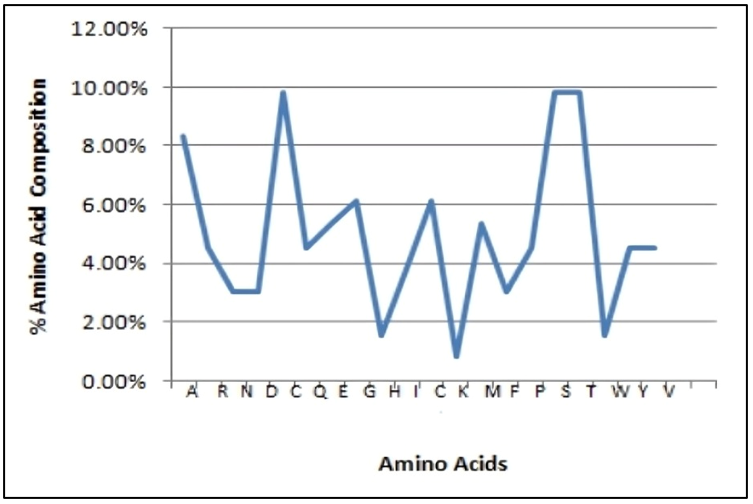
Figure 9: Plot showing the percentage of amino acid residues in the β-subunit of FSH of H. fossilis.
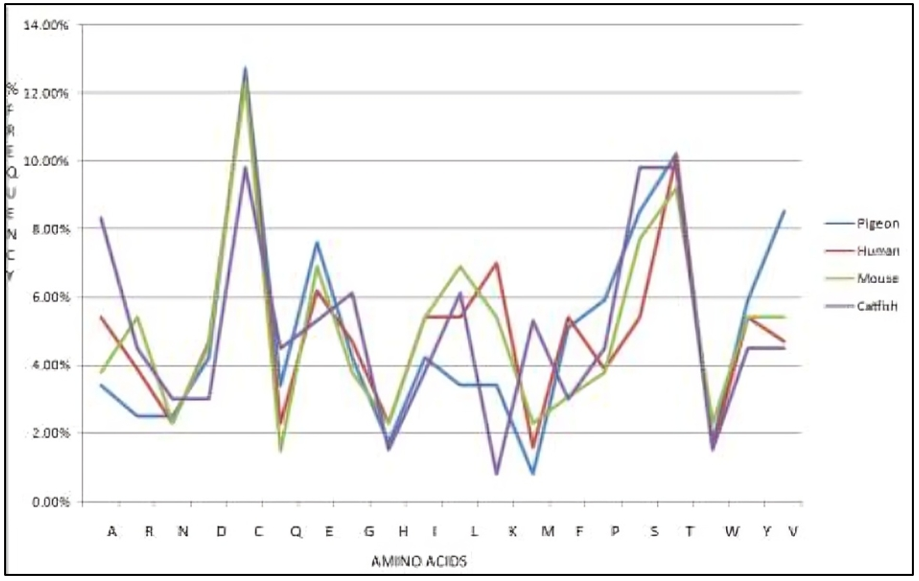
Figure 10: The plot shows the comparative percentage of amino acid residues in the sequence of FSH from pigeon (Columba livia), human (Homo sapiens), mouse (Mus musculus), and catfish (Heteropneustes fossilis).
Figure 11 clearly shows that the β-subunit of FSH of H. fossilis shares the highest degree of similarity with the structure of folliclestimulating hormone in complex with the entire ectodomain of its receptor (PDB ID: 4AY9). Figure 12 shows the superimposed vector representation of the backbone atoms of the β-subunit of FSH in H. fossilis. The VSN view compares the similarity between its structures and that of the structure of follicle-stimulating hormone in complex with the entire ectodomain of its receptor (PDB ID: 4AY9). Figure 13 shows the sequence alignment of the β-subunit of FSH in H. fossilis and the follicle-stimulating hormone in complex with the entire ectodomain of its receptor (PDB ID: 4AY9).
For visualization purposes, the continuous conservation scores are divided into a discrete scale of nine grades. The most variable positions (Figure 14), represented by grade 1, are colored turquoise, while the intermediately conserved positions, represented by grade 5, are colored white. The most conserved positions, represented by grade 9, are colored maroon. These conservation scores are then mapped onto the protein or nucleotide sequence and displayed on the ConSurf Color-Coded Multiple Sequence Alignment (MSA). Regions of the protein that align closely with known structures are highlighted in similar colors, whereas divergent regions are marked in contrasting hues. This visual distinction aids in identifying conserved motifs and functional domains in protein’s evolutionary relationships and biological functions.
Figure 15 depicts the evolutionary conservation of amino acid positions within the β-subunit of follicle-stimulating hormone (FSH) in H. fossilis. The highly conserved residues are shaded purple and blue, while variable regions are marked in warmer colors like pink and light blue. The space-filling 3-D representation of the β-subunit of FSH in H. fossilis is shown in figure 16, using color-coded regions to illustrate the molecular surface and spatial configuration of the protein.
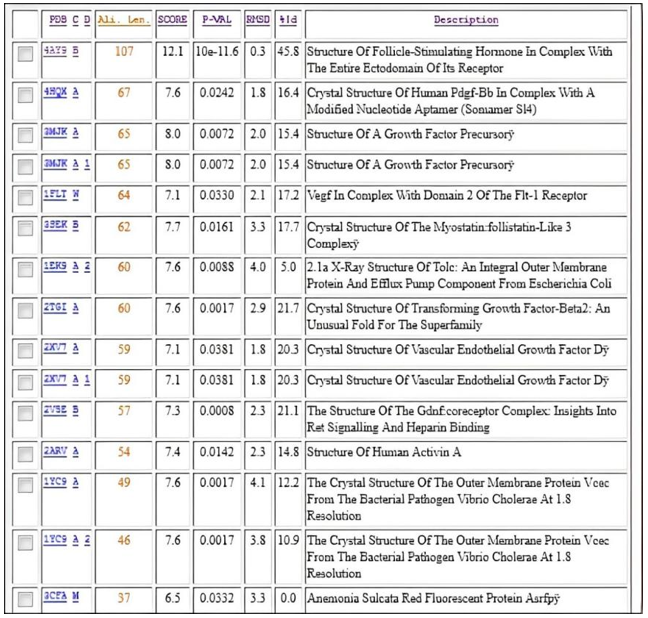
Figure 11: Structure alignment using Vector Alignment Search Tool.
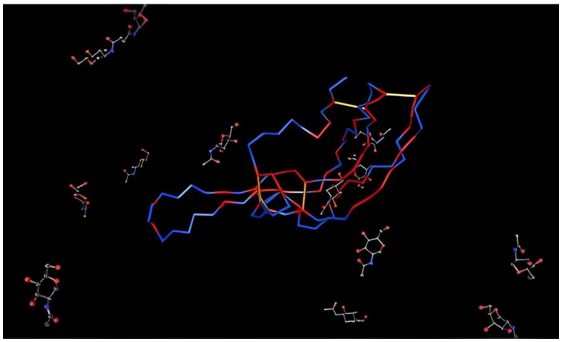
Figure 12: Vector Superposition Network (VSN) view of the backbone structure of the β-subunit of FSH of H. fossilis generated using the VAST.
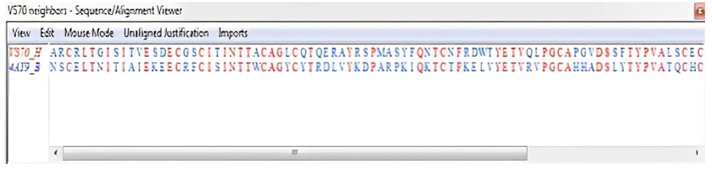
Figure 13: VAST Structure alignment in Cn3D format.
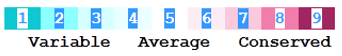
Figure 14: Color variations indicate differences in properties as shown by ConSurf.
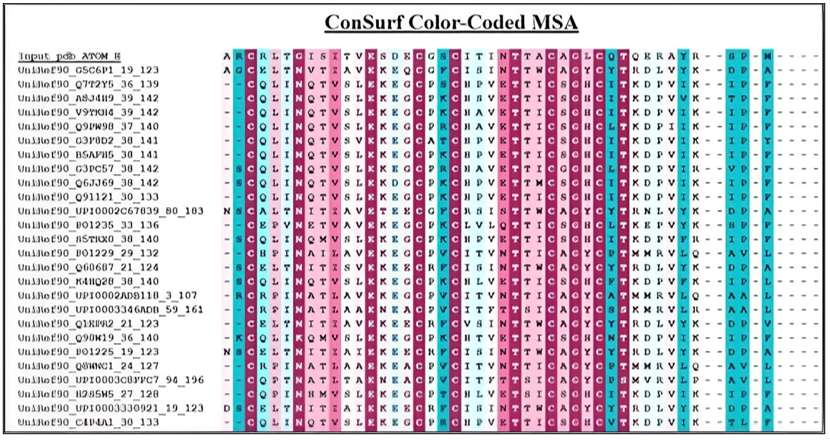
Figure 15: Color-coded MSA of the PDB structure of the β-subunit of FSH of H. fossilis.
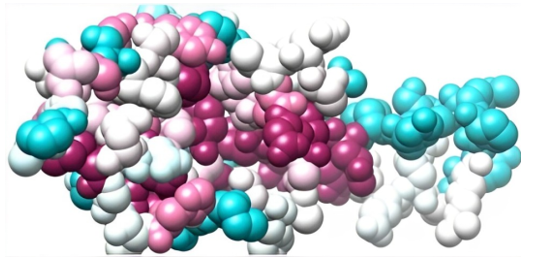
Figure 16: A space-filling 3-D representation of the β-subunit of FSH of H. fossilis using color-coded regions.
From figure 17, it is evident that H. fossilis has 38 hydrophobic clusters, whereas M. musculus, H. sapiens, and C. livia have 24, 27, and 31 hydrophobic clusters, respectively.
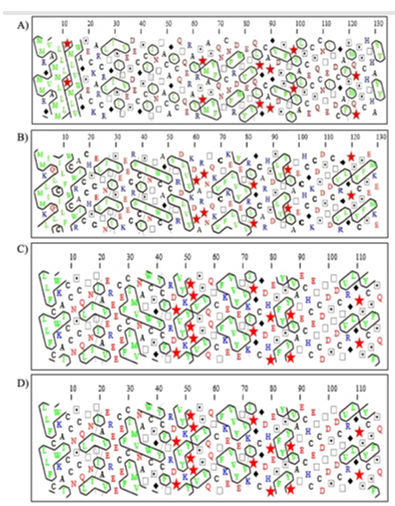
Figure 17: HCA of the FSH of Heteropneustes fossilis (A), Mus musculus (B), Columba livia (C), and Homo sapiens (D), respectively.
Stinging catfish (Heteropneustes fossilis) is a key aquaculture species due to its growth and nutrition. It is an excellent model due to its biological conservation and high fecundity. Folliclestimulating hormone, secreted by the pituitary gland, regulates gonadal development and maturation. It acts through a G-proteincoupled receptor on the surface of target cells to stimulate testicular and ovarian functions. It also induces the maturation of ovarian follicles by targeting the follicle-stimulating hormone receptor expressed exclusively on granulosa cells in females. However, the Protein Data Bank lacks the 3-D structure of the follicle-stimulating hormone in H. fossilis.
Thus, in our study, we attempted to model the 3D structure of the β-subunit of FSH of H. fossilis, as it was not available in the Protein Data Bank (PDB). The preliminary structure was predicted by automated homology modeling using SWISS-MODEL (Figure 2). According to SWISS-MODEL, the QMEAN4 score is a composite score derived from a linear combination of four statistical potential terms to estimate model reliability. It ranges from 0 to 1. The pseudo-energies and Z-scores of these terms are compared with high-resolution experimental structures of similar size solved by X-ray crystallography. A Z-score represents the number of standard deviations away from the mean, with a value of zero being ideal; negative values indicate below-average quality, while positive values indicate above-average quality. An RMS Z-score should be close to 1.0, with deviations indicating potential issues.
We utilized the KoBaMIN server to minimize the energy of the original SWISS MODEL structure. The orientation of the energyminimized was observed to be slightly different from that of the original structure (Figure 4). Upon superimposition, it was found that there was no difference in RSMD between the two structures, but slight differences were observed in loop regions as these regions were not completely superimposed (Figure 5). The Ramachandran plot assessment shows most of the residues in the favored regions (Figures 7 and 8). The physio-chemical parameters studied through Protparam analysis suggested the hydrophobic nature of the energy-minimized structure (Table 4).
The accuracy of a protein model can vary significantly, even within different regions of the same protein. Inaccurate targettemplate alignments are the most frequent source of errors in models. This is especially true when the sequence similarity between the target and the template sequence drops below 40%, and manual editing of the alignment becomes a necessity to achieve a satisfactory model. Often, highly conserved core regions are modeled much more reliably than variable loop regions or surface residues. In our study, the VAST analysis (Figure 11) of our modeled structure revealed that out of 107 residues, only 50 were aligned, resulting in a 45.38% structural similarity with proteins available in the Molecular Modeling DataBase (MMDB). This analysis also indicated that no closely related protein structures were available. However, the RMSD value of 0.3 demonstrates a high degree of similarity between our structure and the structure of the folliclestimulating hormone in complex with the entire ectodomain of its receptor (PDB ID: 4AY9) [20].
Furthermore, the darker region (purple shades 7-9) identified through ConSurf server analysis shows a more conserved region. It indicates that the functional site resides at the core of this protein. These sites can serve as potential targets in drug discovery initiatives (Figure 14). Hydrophobic Cluster Analysis (HCA) is based on a two-dimensional representation of the protein sequence, in which hydrophobic amino acids congregate into clusters. HCA is often considered an approach allowing the prediction of secondary structures from the only knowledge of a protein sequence. It, however, allows combining this prediction with the comparison of 1D sequence, which makes it a powerful tool for helping the identification of remote relationships. The HCA analysis indicates the presence of hydrophobic patches on the surface of the FSH of H. fossilis making it more hydrophobic as compared to the other three sequences analyzed in our study (Figure 17).
Humans and fish share numerous developmental pathways, organ systems, and physiological mechanisms. Therefore, we can consider catfish an exemplary model organism to explore various studies for advancements in human welfare and agriculture. Through our pioneering attempt to model the 3-D structure of the β-subunit of the FSH from H. fossilis, previously unavailable in the PDB, we have determined that it predominantly consists of a single peptide chain, and two pairs of anti-parallel β-sheets and loops in addition. Moreover, it exhibits hydrophobic characteristics. Our findings can serve as the basis for investigating the effects of follicle-stimulating hormones across different organisms, and hold promise for developing novel drugs targeting specific sites identified through our structural predictions. Our research also highlights the potential of using catfish as a model to bridge gaps between basic research and practical applications in medicine and agriculture.
The authors declare that no funds, grants, or other support were received during the preparation of this manuscript.
The authors have no relevant financial or non-financial interests to disclose.
The authors declare that no funds, grants, or other support were received during the preparation of this manuscript.
The datasets generated during and analyzed during the current study are available in this manuscript itself.
Copyright: © 2024 Radha Chaube., et al. This is an open-access article distributed under the terms of the Creative Commons Attribution License, which permits unrestricted use, distribution, and reproduction in any medium, provided the original author and source are credited.
 Open Access by
Acta Scientific is licensed under a Creative Commons Attribution 4.0 International License
Open Access by
Acta Scientific is licensed under a Creative Commons Attribution 4.0 International License
Based on a work at https://actascientific.com
ff


