Serbest Bilici1*, Muhammed Yaşar Dörtbudak2, Alaettin Kaya3, Tarık Çiçek4 and Erhan Ünlü4
1Department of Animal Science, Faculty of Agriculture, Şırnak University, Şırnak, Türkiye
2Department of Fisheries and Diseases, Faculty of Veterinary, Harran University, Şanlıurfa, Türkiye
3Department of Basic Science, Faculty of Veterinary Medicine Faculty, Dicle University, Diyarbakır, Türkiye
4Department of Biology, Faculty of Science, Dicle University, Diyarbakır, Türkiye
*Corresponding Author: Serbest Bilici, Department of Animal Science, Faculty of Agriculture, Şırnak University, Şırnak, Türkiye.
Received: September 02, 2024; Published: September 26, 2024
Citation: Serbest Bilici., et al. “Gender, Age and Seasonal Variation in Scale Characteristics of Carassius Gibelio (Bloch, 1782) from the Tigris River, Turkey: A Geometric Morphometric Study”. Acta Scientific Veterinary Sciences 6.10 (2024): 22-31.
In this study, individuals of Carassius gibelio (Bloch, 1782) comprising 85 females and 34 males were collected from the Tigris River in Şırnak, Turkey. The size and shape of the scales were analyzed separately using 2D geometric morphometric methods, with scale size treated as the center size. Procrustes ANOVA indicated significant differences between the groups in both size (center size) and shape. Scale size increased with age among the age groups, while seasonal analysis revealed that autumn samples exhibited the largest scale size, whereas summer samples had the smallest. Female specimens were generally larger than their male counterparts. In the principal component (PC) analysis based on gender, the first two principal components (PC1 and PC2) accounted for 59.8% of the total variance, contributing 42.7% and 17.1%, respectively. When analyzing by age, PC1 and PC2 explained 57.7% of the variance, with contributions of 41.2% and 16.5%, respectively. Seasonal PC analysis showed that PC1 and PC2 accounted for 59.3% of the total variance, with 42.7% and 16.6% contributions, respectively. Canonical Variate Analysis (CVA) for gender demonstrated a significant difference between the two genders. In the seasonal CVA, significant differences were observed among the autumnsummer, summer-spring, and spring-winter group comparisons. For age groups, significant differences were found between age groups 2-5, 2-6, and 2-7 as well as between 3-5 and 3-6; however, the differences among the other age groups were not statistically significant. In the shape analysis through Discriminant Function (DF) analysis, the female individuals exhibited larger dorso-ventral scale dimensions, with the difference reaching significance according to both parametric and permutation p-values for T2.
Keywords: Cyprinidae; Geometric Morphometrics; Landmark Analysis; Scale Shape; Turkey
Cyprinidae is the largest family of freshwater fish, with a broad geographical distribution that spans North America, Africa, and Eurasia [1]. In Turkey, approximately 15% of freshwater fish species, totaling 59 species, belong to the family [2,3]. The focus of this study, Carassius gibelio (Bloch, 1782) (Figure 1), is found in the Tigris and Euphrates river systems [4-7]. Carassius gibelio is considered one of the first cyprinid species used by humans in fisheries outside its native distribution area [8,9]. This omnivorous species thrives in both lentic and lotic habitats and is recognized as a highly invasive species, often outcompeting native fish populations [10,11]. Notably, Carassius gibelio can survive for extended periods under extreme environmental conditions, such as high turbidity and eutrophication, even without oxygen [12,13].
Several aspects of Carassius gibelio have been investigated, such as its distribution, gender ratio, growth [14], reproductive biology [14,15], and feeding biology [16]. However, few studies have focused on the morphological variations of Carassius gibelio [17-19].
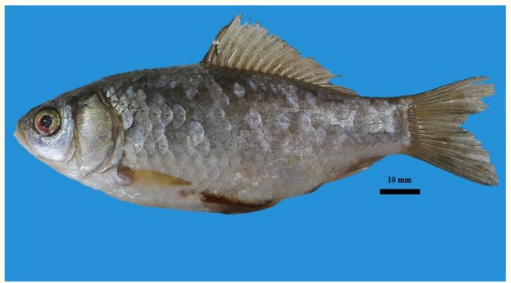
Figure 1: General appearance of Carassius gibelio from the Tigris River.
Fish scales serve as valuable tools for identifying fish at the genus or species level, as well as for studies on fish phylogeny, sexual dimorphism, age determination, and habitat effects on development [20-28]. While fish scales are acknowledged as important for classification, they have been found to be less effective for specieslevel identification. Instead, they are more suitably used as an age index [29]. The external morphology of fish and scale models has been reported as useful for establishing phylogenetic relationships [29]. Recent scanning electron microscopy (SEM) studies have provided detailed insight into the shapes of teleost fish scales, enhancing their use for taxonomic purposes [30]. Fish populations exhibit varying growth characteristics influenced by factors such as environmental conditions, seasonal changes, habitat type, and food availability, and scales reflect these phenotypic variations [31].
Geometric morphometrics (GMM) offers a powerful approach to detect subtle morphological variations often overlooked by conventional methods [32]. Geometric morphometric analyses of scales have proven to be a reliable tool for distinguishing habitat impacts on scale morphology, as well as identifying age and seasonal differences, despite the challenges in differentiating between genera, species, geographical variants, and local populations. This method allows for the examination and monitoring of samples, which can be safely released back into their habitats, enabling the collection of large sample sizes from populations. Fish scales are ideal for 2D geometric morphometric techniques, as they can vary with age, gender, and season. Additionally, scales can help identify sources of variation in fish size and shape [3,18,27,33-36].
This study employs geometric morphometric methods to investigate the characteristic structure of Carassius gibelio scales. Additionally, it aims to evaluate differences in scale morphology between male and female individuals, providing insights into potential sexual dimorphism within the species.
A total of 119 fish specimens were collected from four different locations in the Tigris River, specifically from the Güçlükonak locality in Şırnak, Türkiye. This collection comprised 85 females and 34 males (Figure 2).
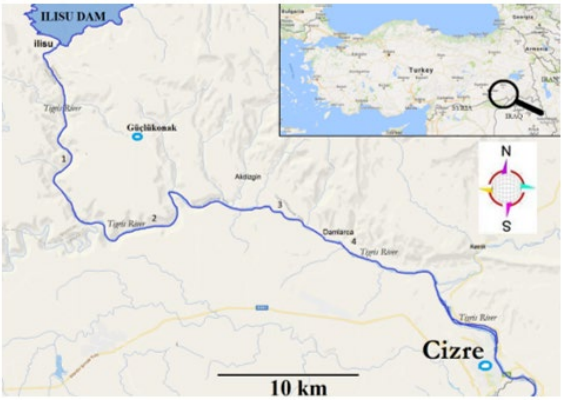
Figure 2: Map of the study area showing the sample locations: 1) Tigris River (Güçlükonak), 2) Tigris River (Güçlükonak), 3) Tigris River (Akdizgin), 4) Tigris River (Damlarca).
The scales of Carassius gibelio specimens were collected from the anterior dorsal fin and the upper part of the lateral line. The age-determined scales were photographed under consistent conditions using a Canon SX7 binocular equipped with an Olympus digital camera (see Figure 3). Six landmarks were recorded using tpsUtil and tpsDig ver. 2.32 [37]. Geometric morphometric analysis (GPA) was then performed.
Following the shape and size discrimination, Procrustes ANOVA, PCA, CVA, and CFA analyses were conducted with MorphoJ 1.08.02 [38]. Box-violin plot charts of LogCS for different groups were created using R software [39] and Jamovi (2023).
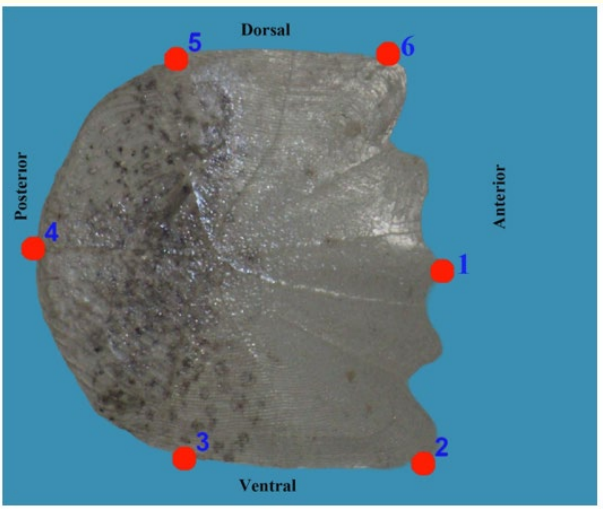
Figure 3: Definitions of landmarks used in the fish scales of Carassius gibelio.
The Procrustes ANOVA results indicated that the groups differed significantly in both size (CS) and shape (Table 1).
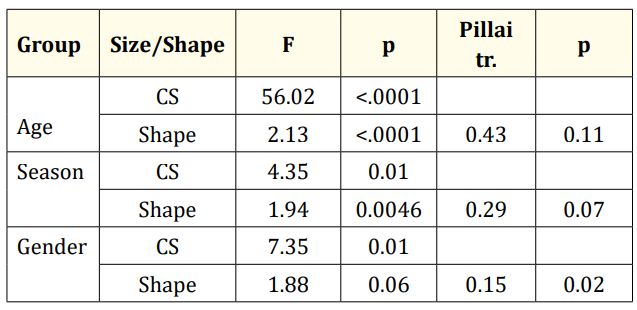
Table 1: Procrustes ANOVA results (F: Goodal’s F, CS: Centroid Size).
Analysis of the CS box plot reveals that scale size increases with age among the different age groups. Among the seasonal groups, autumn (Au) scales are the largest, while summer (Sm) scales are the smallest. Additionally, female specimens tend to be larger in size (Figure 4).
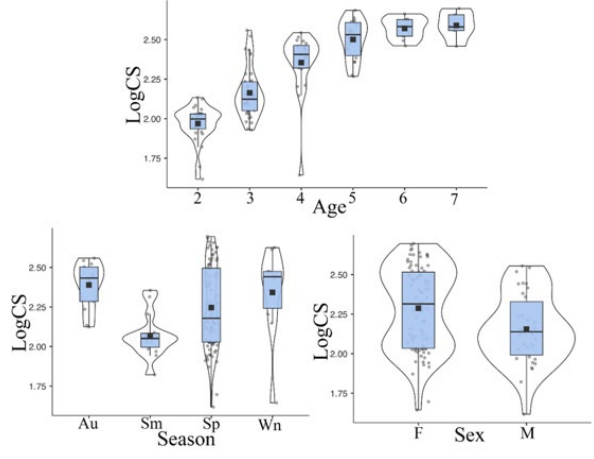
Figure 4: Box and Violin plot of CS of scales by gender, age and season).
In the PCA based on gender, PC1 and PC2 accounted for 59.8% of the total variance, with 42.7% explained by PC1 and 17.1% by PC2. For the PCA based on age groups, PC1 and PC2 explained 57.7% of the total variance, with 41.2% attributed to PC1 and 16.5% to PC2. In the PCA based on seasonal groups, PC1 and PC2 accounted for 59.3% of the total variance, with 42.7% explained by PC1 and 16.6% by PC2. The graph indicates that there is significant overlap among all groups on both the PC1 and PC2 axes (Figure 5).
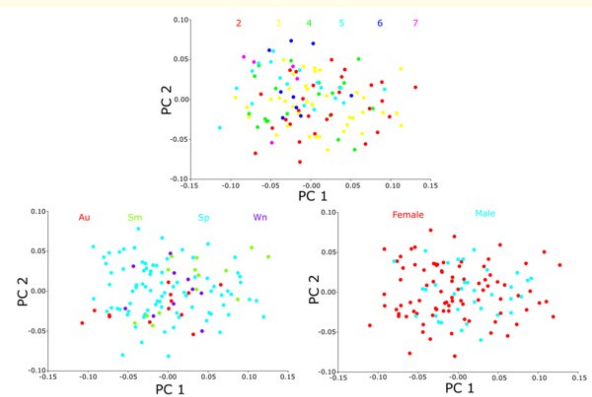
Figure 5: Scatter plot of principal component analysis (PCA) showing the distribution of scales by gender, age, and season.
The CVA conducted on gender reveals a significant difference between the genders (Table 2, Figure 6).

Table 2: CVA result of scales by gender (Mah.Dist: Mahalanobis distance, Proc. Dist: Procrustes distance, P val: P value of permutation test).
In the CVA for age groups, significant differences were observed between the 2-5, 2-6, and 2-7 age groups compared to the 3-5 and 3-6 age groups. However, differences between the other age groups were not statistically significant (Table 3, Figure 6).

Table 3: CVA result of scales by age (Mah.Dist: Mahalanobis distance, Proc. Dist: Procrustes distance, P val: P value of permutation test).
The CVA conducted for seasonal groups shows significant differences between autumn and summer, summer and spring, as well as spring and winter (Table 4, Figure 6).

Table 4. CVA result of scales by season (Mah.Dist: Mahalanobis distance, Proc. Dist: Procrustes distance, P val: P value of permutation test).
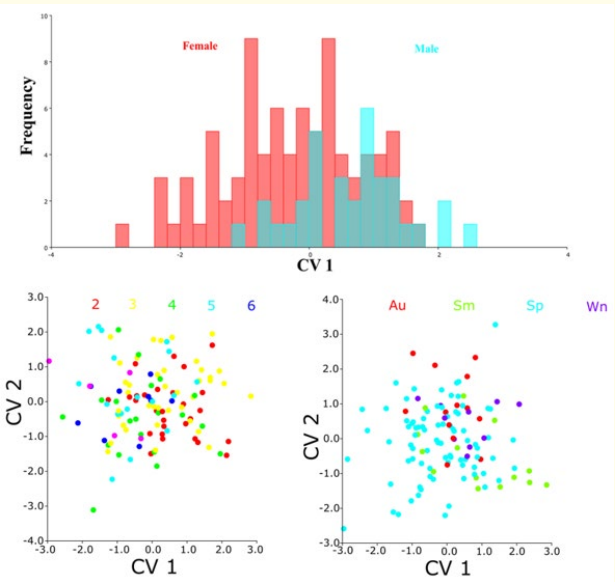
Figure 6: CVA plot of scales by gender, age and season.
The shape difference analysis in DF revealed that female scales were larger dorso-ventrally. This difference was significant based on both the parametric p-value and the permutation p-value for T2 (Table 5, Figure 7).

Table 5: DFA results f of scales by gender (T2: T-square, Param. p: Parametric P values, Perm. P: Permutation P value, Bolded: significant)
Among the seasonal groups, the summer group exhibited larger dorsal and antero-ventral scales compared to the autumn group, with significant differences based on the permutation p-value for Procrustes. Additionally, the summer group had smaller dorsoventral scales and was longer anteriorly compared to the spring group, with these differences also being significant according to the permutation p-value for Procrustes (Table 6 and Figure 7).
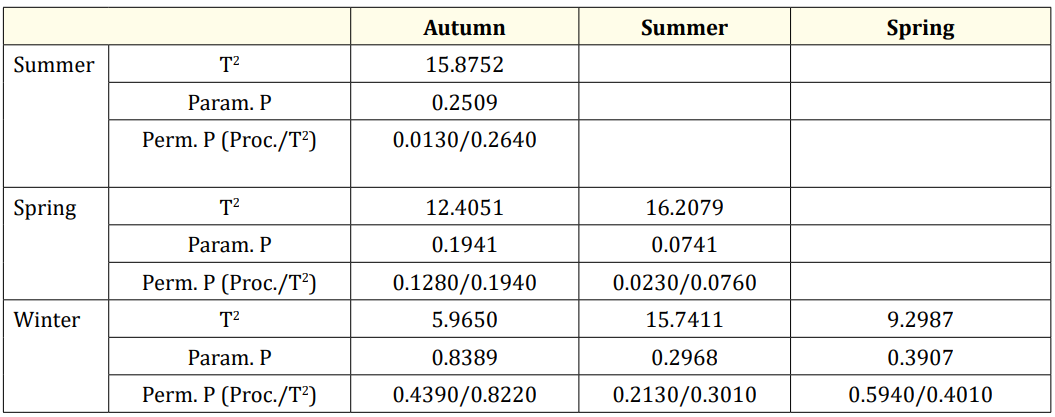
Table 6: DFA results f of scales by season (T2: T-square, Param. p: Parametric P values, Perm. P: Permutation P value, Bolded: significant).
Among the age groups, the 2-year-old group had longer dorsoventral scales and shorter anterior-posterior scales compared to the 5, 6, and 7-year-old groups. Significant differences were found for both parametric and permutation p-values between the 2- and 5-year-old groups. For the 2- and 6-year-old groups, differences were significant based on the permutation p-value for Procrustes.
Similarly, both parametric and permutation p-values indicated significant differences between the 2- and 7-year-old groups. The 3-year-old group also had longer dorso-ventral scales than the 5 and 7-year-old groups, with these differences being significant according to the permutation p-value for Procrustes (Table 7, Figure 8).
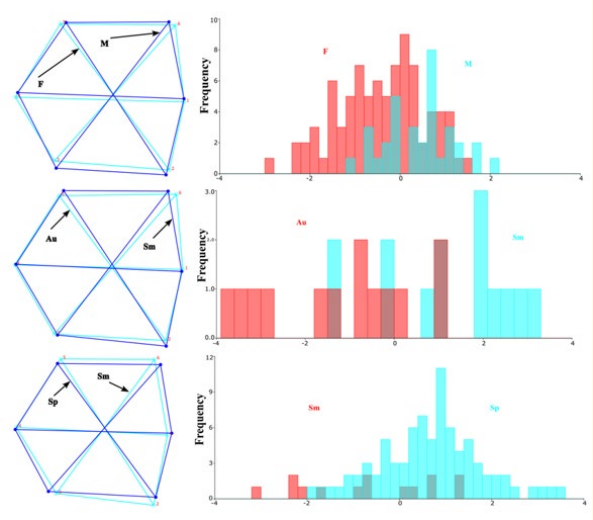
Figure 7: Shape differences and DFA histograms of scales by gender, season (F: female, M: male: Au: autumn, Sm: summer, Sp: spring).
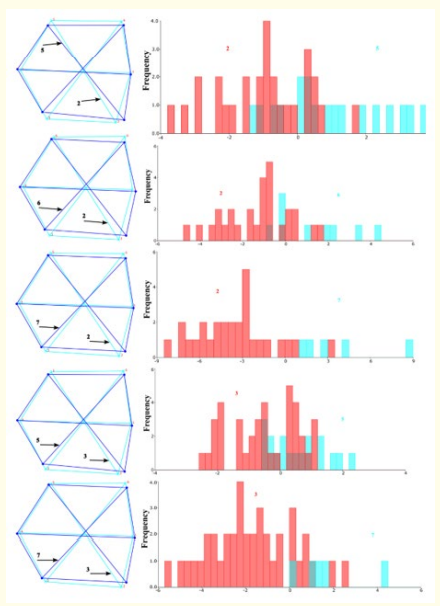
Figure 8: Shape differences and DFA histograms of scales by age, numbers represent ages.

Table 7: DFA results f of scales by age (T2: T-square, Param. p: Parametric P values, Perm. P: Permutation P value, Bolded: significant).
Fish scales contain small growth rings that help determine the age of the fish. These rings, typically composed of CaCO₃, are arranged around a central point [40,41]. Variations in these rings occur due to periods of accelerated scale growth during times of abundant feeding, usually in spring and summer, and reduced or halted growth during periods of scarce feeding, particularly in winter [42]. The structure of annual growth rings in fish scales can be influenced by environmental conditions, making this differentiation important for understanding the physicochemical parameters of the environment and feeding patterns [18]. Changes in the shape of fish scales can thus help differentiate between populations [26,34]. Moreover, interspecific morphological variability can indicate genetic differences or reflect environmental conditions within the context of phenotypic plasticity [43,44].
Geometric morphometrics is particularly valuable in fish scale studies because it allows for a quantitative analysis of shape and size variation that traditional morphometrics cannot achieve [44,45]. This method provides a detailed understanding of shape and size variations and can address questions related to taxonomy and ecology. It enables the visualization and analysis of complex patterns of shape change, making it an essential tool for researchers studying fish scales [46,47].
[48] successfully applied geometric morphometric methods to Capoeta trutta and Capoeta umbla. Similarly, this study achieved success with Carassius gibelio. Analysis based on gender revealed that female specimens were larger than males, demonstrating the effectiveness of geometric morphometric analysis in distinguishing fish species.
Previous studies have also successfully utilized this type of analysis. For instance, research on fish scale and otolith morphometry and geometry has provided significant insights [18,28,33,34,48-53]. Additionally, studies examining the relationship between fish size and otolith morphometry have proven effective for species identification [18,50].
In this study, Procrustes ANOVA results revealed significant differences in size (CS) and shape among age and gender groups, with seasonal groups showing significant differences only in size. Specifically, scale size increased with age, with autumn (Au) scales being the largest and summer (Sm) scales the smallest. Female specimens were larger overall (Table 1, Figure 4).
PCA results showed that PC1 and PC2 explained 59.8% of the total variance for gender groups, with PC1 contributing 42.7% and PC2 17.1%. For age groups, PC1 and PC2 explained 57.7% of the total variance, with PC1 at 41.2% and PC2 at 16.5%. In the seasonal groups PCA, PC1 and PC2 accounted for 59.3% of the variance, with PC1 explaining 42.7% and PC2 16.6% (Figure 5).
CVA results indicated sufficient differences between genders (Table 2, Figure 6). For seasonal groups, significant differences were found between autumn-summer, summer-spring, and springwinter pairs (Table 4, Figure 6). In age groups, differences were significant between the 2-5, 2-6, 2-7, 3-5, and 3-7 age groups, but not between other age groups (Table 3, Figure 6).
DF analysis showed sufficient shape differences between genders (Table 5, Figure 7), age groups 2-5, 2-6, 2-7, 3-5, and 3-7 (Table 6, Figure 8), and seasonal groups autumn-summer and spring-summer (Table 6, Figure 7). Specifically, female scales were larger dorso-ventrally, with differences being significant according to both parametric and permutation p-values for T2.
Fish scales are an important structure that contains important information about the biology and ecology of the fish and is important in revealing the systematics of the taxon to which it belongs. Analyzing this structure with methods such as geometric morphometrics allows us to reach many new and accurate information. As in this study, fish scales were analyzed by geometric morphometric method and provided us with important information about the scale shape and size of Carassius gibelio in sex, age and season groups. Thus we have the chance to obtain new information about the species with no or minimal damage to that species.
No conflicting interests and no funding in connection with this paper are applicable.
The data supporting the findings of this study are available from the corresponding author upon reasonable request.
Copyright: © 2024 Serbest Bilici., et al. This is an open-access article distributed under the terms of the Creative Commons Attribution License, which permits unrestricted use, distribution, and reproduction in any medium, provided the original author and source are credited.