Tripti Kumari1*, Chandrashree Lenka2 and Pravabati Guru3
1Research Scholar, Sambalpur University, India
2Professor & Head R. D womens University, BBSR, India
3Former Regional Director, RDE Sambalpur, India
*Corresponding Author:Tripti Kumari, Research Scholar, Sambalpur University, India
Received: September 12, 2024; Published: September 26, 2024
Citation: Tripti Kumari., et al. “Nutritional Status of Under Five -Children in Urban Slums: A Cross-Sectional Study in Sambalpur District, Odisha". Acta Scientific Dental Sciences 8.10 (2024):58-64.
Background: The nutritional status of children under five in slums is vital for evaluating the overall health of these populations. Malnutrition in these children reflects broader issues of inadequate nutrition and poor living conditions. Limited accesses to essential resources in slum environments exacerbate their vulnerability to growth problems and infectious diseases.
Methods: A community-based cross-sectional study was carried out from 2022 to 2023 in urban slums of Sambalpur District, involving 550 children aged 6-60 months selected via simple random sampling from 20 urban slums. Data were gathered through home visits and interviews with mothers using a pre-designed, pre-tested interview schedule. Anthropometric measurements and nutritional assessments followed WHO (2006) guidelines.
Results: In the study of 550 children, the analysis showed that stunting was the most prevalent i.e. 42.8%, followed by underweight 34.7%, and wasting at 22.4%. The rates of overweight were 1.5% in boys and 2.1% in girls. The study found no significant association between malnutrition and gender.
Conclusion: Malnutrition among under-five children was notably high. Childhood malnutrition results from multiple factors, addressing it effectively requires a comprehensive, multifaceted approach rather than focusing on a single cause.
Keywords: Mild; Moderate; Severe; Stunting; Wasting; Underweight; Under-Nutrition
Nutrition is crucial for a child's health, playing a vital role in preventing disease and reducing mortality. Malnutrition is a multifaceted issue that encompasses several categories: undernutrition, which includes wasting, stunting, and underweight; micronutrient deficiencies; and conditions such as overweight, obesity. This global challenge affects every country. According to the WHO, approximately 45 million children under five years old are wasted, with 17 million of these being severely wasted. Additionally, 155 million children are stunted, and 41 million are either overweight or obese. Malnutrition remains a leading cause of mortality in children under five, accounting for nearly half of all deaths in this age group. Furthermore, low- and middle-income countries are experiencing a growing prevalence of childhood overweight and obesity. In India, malnutrition among children under five is a significant public health issue. Odisha is one of the poor state of India, faces significant malnutrition issues, particularly in urban slum areas where inadequate healthcare infrastructure and a large migrant population exacerbate child health problems. Sambalpur, located in western Odisha, is notably affected due to its substantial slum population, and there is a lack of recent research on malnutrition in under five children in this region.
To determine the prevalence of stunting, underweight, and wasting among children under five in the urban slums of Sambalpur District.
An observational, descriptive, community-based cross-sectional study was conducted among under-five children in the urban slums of Sambalpur District, Odisha, after getting permission from the DSWO. The study was conducted during 2022-23.

Table 1: Comparison of gender wise nutritional status of children based on height-for-age Z-score (stunting).
NS: Not Significant.
Table 1 presented a comparison of nutritional status by gender based on height-for-age Z-scores. Among boys, 37.3% were normal, while 22.8% had mild stunting, 20.9% had moderate stunting, and 19.0% had severe stunting. For girls, 33.3% were normal, with 25.2% experiencing mild stunting, 25.5% moderate stunting, and 16.0% severe stunting. Gender did not significantly influence the prevalence of stunting among the children. In a similar study by Gautam S.K., et al. (2018) [1], it was observed that severe stunting was more prevalent among males (14.81%) compared to females (12.44%). However, the relationship between gender and height-for-age was not statistically significant (p > 0.05).

Table 2: Comparison of gender wise nutritional status of children based on weight-for-age Z-score (Under-weight).
NS: Not Significant.
Table 2 detailed the nutritional status of boys and girls based on weight-for-age Z-scores. Among boys, 1.5% were overweight, 42.5% were normal, 18.7% were mildly underweight, 23.9% were moderately underweight, and 13.4% were severely underweight. For girls, 2.1% were overweight, 40.4% were normal, 25.2% were mildly underweight, 22.7% were moderately underweight, and 9.6% were severely underweight. The chi-square test revealed that no significant difference between boys and girls, indicating similar patterns of underweight and overweight across genders. A similar study done by Camala B. (2019) [2], reported a slightly different distribution but similar trends. Among boys, 42.25% were well-nourished, while the percentages for mild, moderate, and severe underweight were 29.41%, 19.25%, and 9.09%, respectively. For girls, 40.71% were well-nourished, with 37.17% mildly underweight, 15.93% moderately underweight and 6.19% severely underweight. A chi-square test indicated no significant difference in nutritional status between boys and girls based on weight-for-age.
Another study done by Gupta V., et al. (2019) [3], moderate underweight was observed to be more common in girls (29.7%) compared to boys (25.2%). On the other hand, severe underweight was more prevalent among boys (11.6%) than girls (10.6%). However, these differences were found to be statistically insignificant.

Table 3: Comparison of gender wise nutritional status of children based on weight-for height Z-score (Wasting).
NS: Not Significant.
Table 3 displayed the nutritional status of boys and girls based on weight-for-height Z-scores. Among boys, 60.4% were classified as normal, 15.7% had mild wasting, 15.7% had moderate wasting, and 8.2% had severe wasting. For girls, 57.1% were normal, 22.0% had mild wasting, 12.8% had moderate wasting, and 8.2% had severe wasting. There was no significant gender difference for wasting. In a study by Gupta V., et al. (2019), it was observed that moderate wasting was more prevalent among girls (13.3%) compared to boys (12.2%). Conversely, severe wasting was more common in boys (6.8%) than in girls (4.2%). However, these differences were found to be statistically insignificant.
Table 4 compared head circumference (HC) nutritional status between boys and girls. Among boys, 42.9% had normal head circumference, 28.7% had mild HC, 19.8% had moderate HC, and 8.6% had severe HC. For girls, 33.3% had normal HC, 36.2% had mild HC, 20.6% had moderate HC, and 9.9% had severe HC. There was no significant gender difference (χ2 = 5.96, p = 0.113), showing that head circumference status was similar between boys and girls. A study done by Tigga PL., et al. (2016) [3], it was found that the overall prevalence of undernutrition, as assessed by head circumference, was slightly higher among girls compared to boys. The prevalence of severe undernutrition was lower than that of moderate undernutrition for both genders. While the differences in the overall age-specific prevalence of undernutrition between boys and girls were not statistically significant, both sexes were equally affected.

Table 4: Comparison of gender wise nutritional status of children based on based on Head Circumference-for-Age Z-score. NS: Not Significant

Table 5: Comparison of gender wise nutritional status of children based on MUAC-for-Age Z-score.
NS: Not Significant.
Table 5 showed the distribution of wasting among boys and girls. Normal nutritional status was observed in 54.1% of boys and 51.1% of girls. Mild wasting affected 30.2% of boys and 34.8% of girls, while moderate wasting was seen in 13.1% of boys and 11.7% of girls. Severe wasting was present in 2.6% of boys and 2.5% of girls. The chi-square test indicated no significant gender difference, similar levels of wasting among both genders.

Table 6: Association of gender with nutritional status among the participants.
NS: Not Significant
Table 6 compared the prevalence of nutritional issues among boys and girls, focusing on underweight, stunting, wasting, MUAC, and HC below -2 SD. In boys, 37.3% were underweight, 42.2% were stunted, 23.9% had wasting, 15.7% had low MUAC, and 28.4% had low head circumference. Among girls, the corresponding figures were 32.3% underweight, 43.6% stunted, 20.9% wasted, 14.2% with low MUAC, and 30.5% with low head circumference. It showed highest prevalence of stunting followed by underweight and least for wasting. Similar trends for prevalence were noticed in NFHS-5 of Odisha (stunting 31.0%, underweight 29.7%, and wasting 18.1%) and Sambalpur District (stunting 40.7%, underweight 36.3%, and wasting 25.5%). There was no significant gender difference in these nutritional parameters. Both boys and girls had similar prevalence of malnutrition. A similar study done by Camala B. (2019), the overall prevalence of underweight was 28.3% among boys and 22.1% among girls, while stunting was more common in boys at 28.9% compared to 14.2% in girls. Wasting prevalence was 29.9% for boys and 23.0% for girls, with MUAC Z-scores showing 20.3% in boys and 26.6% in girls, and SFT Z-scores indicating 26.7% in boys and 25.7% in girls. The chi-square test revealed no significant gender differences in these nutritional indicators. Another study done by Bisai S., et al. (2010) [5]. It was noted that boys were more malnourished in the form of underweight, stunted and wasted (65.5%; 53.5%; 23.8%;) than the girls (60.9 %; 51.6%; 19.6%), but this was not statistically significant. However, prevalence of severe underweight was significantly higher among boys 19.3 % than their girls 12.8% [6-22].

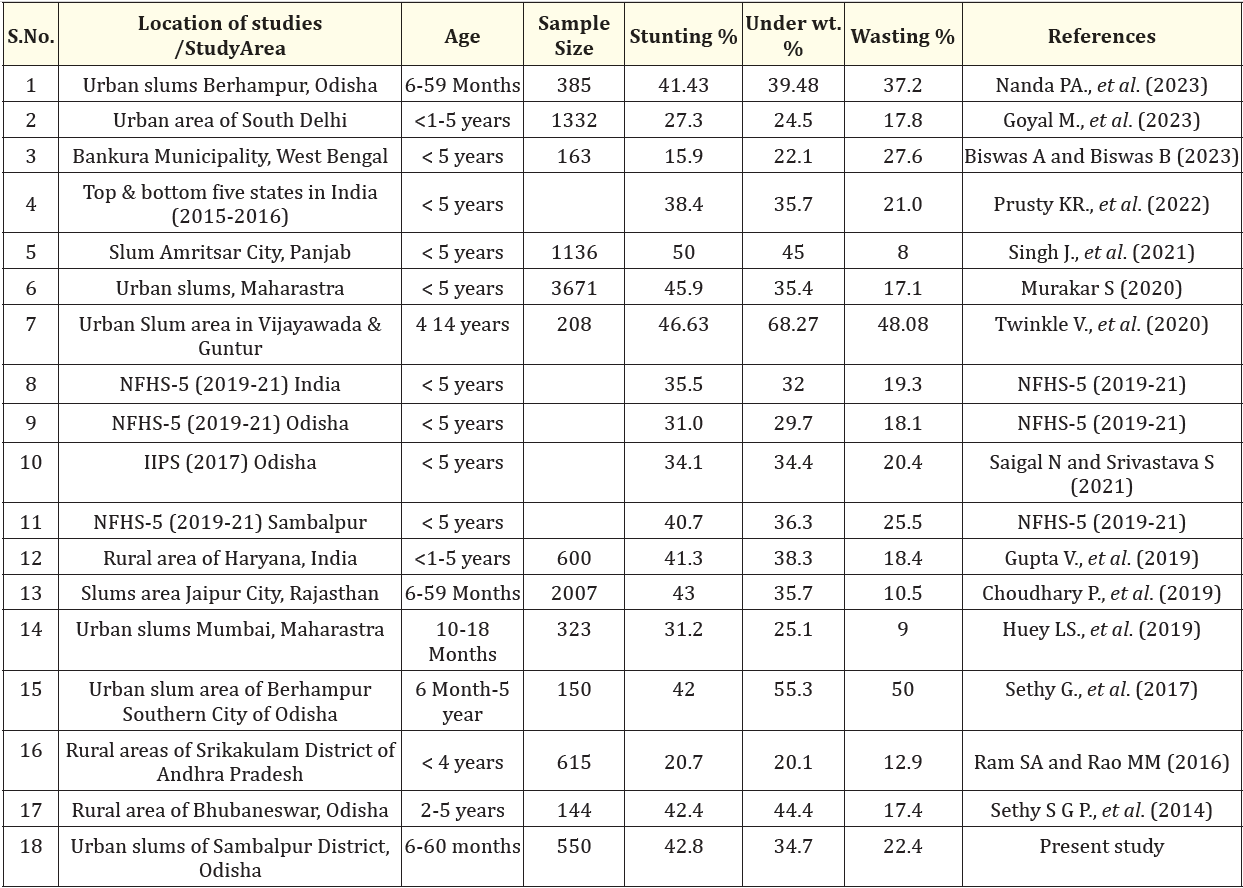
Table 7: Studies on Malnutrition among five-year children in India. Comparison with others studies.

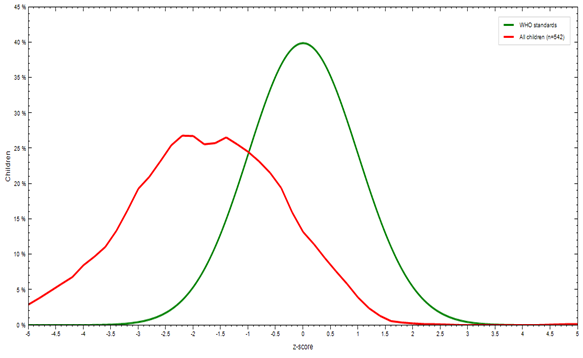
Figure 1: Stunting (Height for age) in under five children.

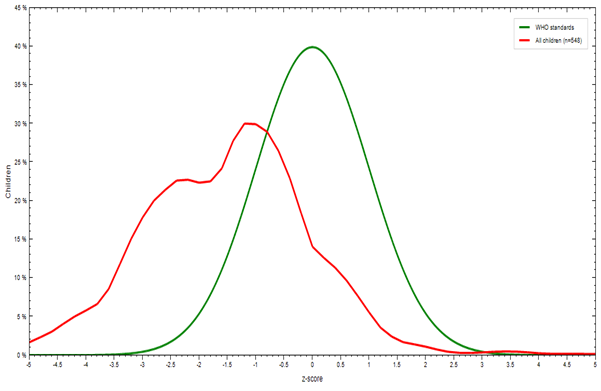
Figure 2: Underweight (Weight for age) in under five children.

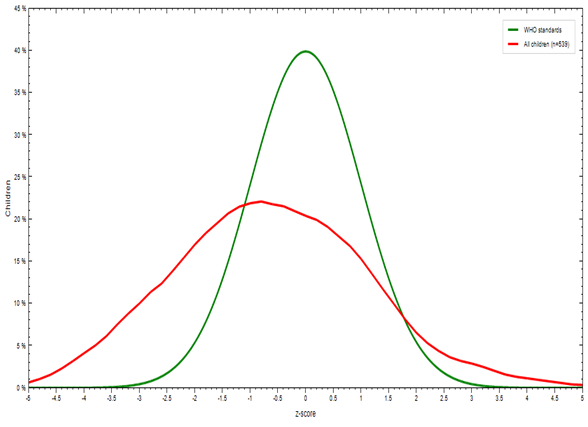
Figure 3: Wasting (Weight for height/length) in under five children.
Table 7 revealed varying prevalence rates of stunting, underweight, and wasting across different study locations, shedding light on regional differences compared to the urban slums of Sambalpur District, Odisha. Stunting rates in Sambalpur (42.2%) were similar to those in Berhampur, Odisha (42%), suggesting common socio-economic and environmental challenges, such as poor living standards and limited nutrition. Conversely, higher stunting rates in Amritsar City, Punjab (50%), and Vijayawada and Guntur (46.63%) may reflect more severe socio-economic hardships, including poverty and inadequate sanitation. In contrast, lower stunting rates in Bankura Municipality, West Bengal (15.9%), and Srikakulam District, Andhra Pradesh (20.7%) suggest better healthcare access and improved living conditions. These variations underscore the significant impact of socio-economic factors, healthcare, and local interventions on child nutrition.
The study found that stunting, underweight, and wasting rates in slum areas exceeded both national and state averages (NFHS-5), though wasting rates was lower than those in District Sambalpur. This highlights a higher incidence of malnutrition among children in slum areas. The analysis showed that malnutrition rates were comparable between boys and girls. Notably, the prevalence of stunting and underweight was more pronounced compared to wasting
Copyright: © 2024 Tripti Kumari., et al. This is an open-access article distributed under the terms of the Creative Commons Attribution License, which permits unrestricted use, distribution, and reproduction in any medium, provided the original author and source are credited.