Victória Silva Chites1, Tainara Aloy dos Santos1, Bárbara Pelicioli Riboldi1, Cíntia Corte Real Rodrigues1, Aline Marcadenti2,3, Ângela Cristina Bersch-Ferreira2, Dirce Maria Lobo Marchioni4 and Jussara Carnevale de Almeida1,5*
1Medical Sciences Graduate Program in Endocrinology, Universidade Federal do Rio Grande do Sul, Brazil
2HCor Research Institute, HCor, Brazil
3Graduate Program in Health Sciences, Instituto de Cardiologia/Fundação Universitária de Cardiologia do Rio Grande do Sul (IC/FUC), Brazil
4Department of Nutrition, Universidade de São Paulo, Brazil
5Department of Nutrition, Universidade Federal do Rio Grande do Sul, Brazil
*Corresponding Author: Jussara Carnevale de Almeida, Medical Sciences Graduate Program in Endocrinology, Universidade Federal do Rio Grande do Sul, Brazil.
Received: August 12, 2024; Published: August 29, 2024
Citation: Jussara Carnevale de Almeida., et al. “The Self-Perception of Patients Using the Wheel of Cardiovascular Health Diet Represents a Novel Tool Designed to Enhance Patients' Awareness of their Dietary Habits" Acta Scientific Nutritional Health 8.9 (2024): 88-99.
Introduction: We have developed the "Wheel of Cardiovascular Health Diet" with the objective of utilizing it in nutritional counseling for patients, intending to enhance their awareness of dietary patterns. Recent observations have demonstrated an association with higher overall dietary quality using the Healthy Eating Index-2020 as reference. However, the agreement between the patient's perception and the nutritionist's assessment needs to be evaluated in this tool.
Methods: In a cross-sectional manner, we enrolled adults with uncontrolled hypertension or type 2 diabetes. The assessment of dietary quality by the patients was obtained through the presentation of the new tool, along with the corresponding intake recommendations for portions. The nutritionist's evaluation was conducted using information from a quantitative food frequency questionnaire, categorized based on the Cardiovascular Health Diet index as either "adequate" or "needs improvement."
Results: In total, 330 patients were included in the study, with an average age of 56.6±11.2 years, 64.8% were females, 91.2% had hypertension, and 58.5% had type 2 diabetes. The mean difference observed between the graph area evaluated by the patients' self-perception and the nutritionist's assessment was 9.3% (95% CI-13.2 to 31.8), and a moderate Spearman’s coefficient correlation was noted. Positive associations were found between self-reported adequate intake and the nutritionist's evaluation of all components (except the processed meat group) of the Wheel of Cardiovascular Health Diet, after adjusting for age, sex, medium-/low-income, or the presence of obesity.
Conclusion: The results suggest that the Wheel of Cardiovascular Health Diet could be a valuable tool to enhance patients' awareness of their diet in the context of nutritional counseling.
Keywords: Dietary Intake; Diabetes Mellitus; Type 2; Hypertension; Self-Report; Diet Quality
BMI: Body Mass Index; FFQ: Food Frequency Questionnaire; HbA1c: Glycated Hemoglobin; UPF: Ultra-Processed Food
Cardiovascular diseases constitute a group of disorders affecting the heart and blood vessels, standing as the leading cause of mortality globally. Presently, lifestyle recommendations for individuals with an elevated risk of cardiovascular disease include tobacco cessation, reduced salt intake, increased consumption of fruits and vegetables, regular physical activity, and moderation in alcohol consumption [1]. Recognizing the significance of nutritional counseling for such patients, gathering information about dietary patterns becomes imperative. While dietary indices have been proposed to assess the overall quality of an individual's or population's diet based on information acquired from food surveys [2,3], these tools typically require professional input, excluding the direct participation of the patient in the assessment process [2-4].
Contemporary recommendations for preventing cardiovascular disease emphasize the importance of patient-centered care, incorporating elements like team-based care, shared decision-making, and the assessment of social determinants of health. These approaches aim to actively involve patients in the decision-making process and consider broader factors that influence health outcomes beyond medical conditions alone [5]. In this context, a tool utilized in coaching processes known as the "Wheel of Life" enables a self-assessment of one's personal or professional situation. This circular instrument is divided into slices, with each slice representing the satisfaction that the individual feels in a specific area of their life. Each segment features a numerical scale, symbolizing the level of satisfaction the individual experiences in that particular area [6]. Given that this tool positions the patient or client as the primary participant in the self-assessment process, relying on their self-awareness of eating behavior, we believe it could be effectively employed in food education. This approach allows individuals to actively engage in evaluating their dietary habits, fostering a sense of personal responsibility and facilitating more targeted and personalized nutritional guidance.
Therefore, we have customized a "Wheel of Life" into a "Wheel of Cardiovascular Health Diet" (Figure 1) for use in nutritional counseling with the aim of increasing patients' awareness of their diet. This tool consists of 11 food groups, each accompanied by recommendations for the ideal quantity and frequency of intake. These recommendations align with the nutritional guidelines of the Cardiovascular Health Diet Index [7], a validated dietary index designed to assess adherence to a healthy diet for cardiovascular health.
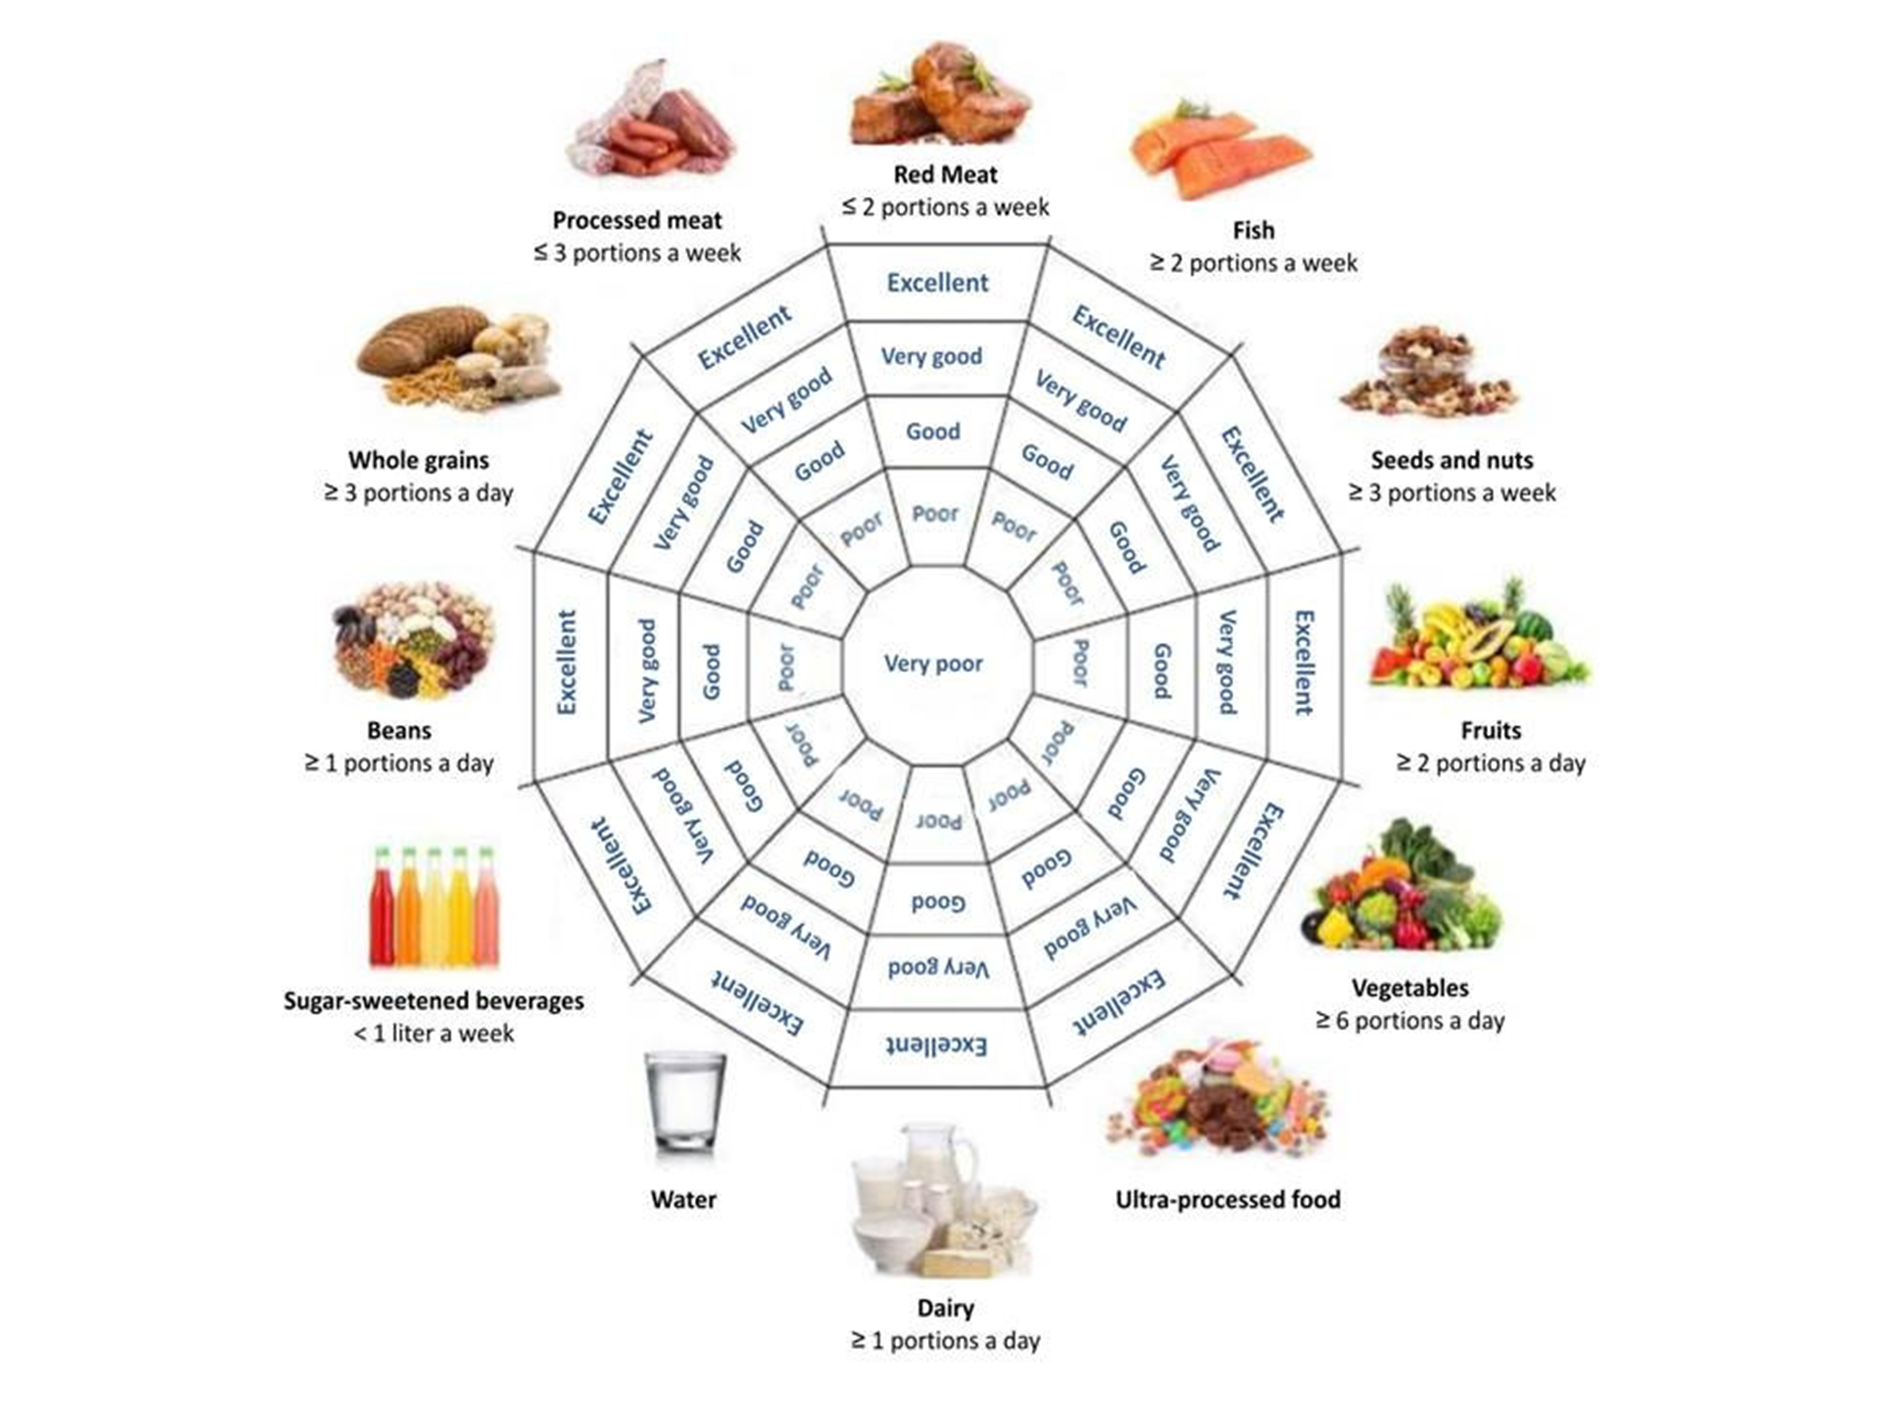
Figure 1: Wheel of Cardiovascular Health Diet. Patients can attribute “excellent” when they are always consuming the recommended portion to “very poor” when they are far from consuming the recommended portion.
The Cardiovascular Health Diet Index, upon which the "Wheel of Cardiovascular Health Diet" is based, originated from the Healthy Diet Score-American Heart Association recommendations [8] with adaptations to suit Brazilian food culture. It incorporates components informed by scientific evidence related to the protection or risk of cardiovascular diseases and other outcomes such as type 2 diabetes mellitus. Recent observations have indicated satisfactory validity and reliability of the "Wheel of Cardiovascular Health Diet" concerning body mass index (BMI), and it has demonstrated an association with higher overall dietary quality using the Healthy Eating Index-2020 as a relative reference [9].
The study hypothesis posits that patients' self-perception regarding their diet aligns well with the nutritionist's evaluation. The instrument allows patients to fill it out themselves, presents visual representations of food groups, and potentially encourages reflection on eating habits (self-knowledge of eating behavior). However, its performance as a new instrument for self-assessment of food consumption needs to be systematically tested. In this context, the current study aims to compare information on diet quality based on the patient's self-perception with the assessment by the nutritionist using the "Wheel of Cardiovascular Health Diet" (concurrent validity).
This study constitutes a cross-sectional analysis of baseline data derived from two randomized, multicenter, parallel clinical trials involving participants diagnosed with type 2 diabetes mellitus and systemic arterial hypertension, who are users of the Health System. Assessments were conducted in 15 institutions spanning various regions of the country, with baseline data collection occurring between 2019 and 2021. This study was conducted according to the guidelines laid down in the Declaration of Helsinki and all procedures involving research study participants were approved by the Hospital de Clínicas de Porto Alegre Research Ethics Committee (ID: 2019-0644). Written informed consent was obtained from all participating patients.
The inclusion criteria for this study encompassed adults with a prior medical diagnosis of hypertension or type 2 diabetes mellitus, presenting with blood pressure or glycated hemoglobin (HbA1c) levels that were off target according to American Guidelines [10-12] during the screening trial period. Additionally, participants should not have received dietary counseling from a nutritionist for at least six months prior to the study. Exclusion criteria were applied to individuals with type 1 diabetes, gestational diabetes, latent autoimmune diabetes of adults, or HbA1c levels ≥ 12%. Other exclusion criteria included patients with resistant or secondary hypertension, severe neuropathy, chronic kidney disease defined by a glomerular filtration rate <60mL/min/1.73m² for more than three months, a diagnosis of cancer or life expectancy less than six months, autoimmune diseases, gastroparesis, pregnancy/lactation, BMI ≥ 40kg/m², cognitive, neurological, or psychiatric conditions, chemical dependency, or alcoholism. Patients who had experienced an episode of Acute Coronary Syndrome in the last 60 days, wheelchair users, and those using chronic steroids or antipsychotics were also excluded.
The patients' comorbidities were gathered from the medical records closest to the nutritional assessment, specifically at the baseline visit. Information on skin color was acquired through self-report, categorized as White or non-White. Smoking status was determined based on self-report, classifying patients as either current smokers or non-smokers (comprising former smokers and those who never smoked). The socioeconomic status was assessed using a standardized Brazilian questionnaire and categorized as high-income or medium-/low-income [13].
Sitting blood pressure was measured on three occasions, with a one-minute interval between each measurement. The readings were taken after a five-minute rest period, employing a standard digital sphygmomanometer (Omron HEM-705CP; Kyoto Head Office, Japan) [14]. The patient was deemed hypertensive if the mean systolic pressure was ≥ 140 mmHg or diastolic pressure was ≥ 90 mmHg on at least two separate occasions. Additionally, individuals receiving pharmacological treatment for hypertension were classified as hypertensive, irrespective of their blood pressure levels [10].
Type 2 diabetes was defined as individuals older than 30 years at onset, with no prior episode of ketoacidosis or documented ketonuria, and who had not used insulin in the five years since diagnosis [15]. Blood samples were collected following a 12-hour fast for the measurement of plasma glucose and HbA1C values. Plasma glucose levels were determined using the glucose oxidase method (biodiagnostica Kit) [16]. HbA1c levels (reference range 4.7-6.0%) were measured through high-precision chromatography in a Merck-Hitachi 9100 system [17].
Anthropometric measurements utilized to evaluate nutritional status included weight, measured with patients wearing light clothing and being barefoot, height, and waist circumference. The waist circumference was measured at the midpoint between the lowest rib margin and the iliac crest [18]. These measurements were acquired using an anthropometric scale for weight and an inelastic fiberglass tape measure for height and waist circumference. All measurements were conducted by a trained research team. Waist circumference cutoff points were defined as 80 cm for women and 94 cm for men, following the criteria set by the International Diabetes Federation [19]. BMI was estimated as weight in kilograms divided by height in square meters [20].
The assessment of the diet's quality by the patient was conducted by presenting the image of the Wheel of Cardiovascular Health Diet (Figure 1) along with the corresponding recommendations for portion consumption. This wheel comprises 11 food groups: red meat, fish, seeds/nuts, fruits, vegetables, ultra-processed foods (UPFs), dairy, processed meat, beans, whole grains, and sugar-sweetened beverages. Each group is accompanied by indications of the optimal quantity and frequency of consumption, aligning with the nutritional recommendations of the Cardiovascular Health Diet Index [7]. It aims to allow a self-assessment of the diet quality, to which the patients can attribute “excellent”-when they are always consuming the recommended portion; “very good” or “good”-when they are frequently consuming the recommended portion; “poor”-when they are rarely consuming the recommended portion; and “very poor”-when they are far from consuming the recommended portion. Some examples of how questions were asked to the patient: "Sir/Madam, when we examine the images of different foods and the recommended portion sizes for each, how would you rate your consumption? For instance, the recommended amount of milk or dairy products is one portion or more per day. What are your thoughts on your milk consumption? Now, let's focus on the processed meat group, which includes meats modified to enhance flavor or extend shelf life, such as ham, sausage, and bacon. The recommended quantity is three portions or less per week. How would you assess your consumption of these processed meats?"
Food intake information was gathered through a quantitative Food Frequency Questionnaire (FFQ) [21] comprising 62 items categorized into 11 food groups. To assist patients in selecting serving sizes, a photo album displaying the average portion of each food item was utilized. The FFQ was administered by a pre-trained research team, which included nutritionists or trainees. The reported intake obtained from the FFQ was converted into daily consumption. The nutritional composition was then estimated using information derived from nutritional composition tables [22,23] and nutrition labels. This process allowed for the calculation of the daily nutritional intake based on the reported food consumption patterns. Participants with an energy intake that fell below the first percentile or exceeded the 99th percentile were excluded from the analyses. This exclusion was implemented to mitigate the risk of underestimating or overestimating energy intake, thereby addressing implausible dietary intake information.
Food was categorized into the respective groups on the Wheel of Cardiovascular Health Diet, and individual portion intake was adjusted per 1,000 kcal. Score points ranging from one to five were assigned to consumption groups based on the metrics proposed by the Cardiovascular Health Diet Index [7]. Specifically, portions considered “standard for a maximum score of 10 points” were designated as “excellent,” with five points attributed in the Wheel of Cardiovascular Health Diet. Portions deemed “standard for a minimum score of 0 points” were labeled as “very poor,” and one point was attributed. For intermediate consumption, a proportional classification was applied: “very good,” “good,” or “poor.” Regarding the ultra-processed food group, intake in grams was divided into quintiles. The lowest quintile was assigned as “excellent,” and the highest quintile was labeled as “very poor.” For intermediate consumption levels, a proportional classification was used: “very good,” “good,” or “poor.”
Cardiovascular risk stratification was derived from a calculator advocated by the HEARTS in the Americas initiative [24]. This calculator estimates the potential 10-year risk of myocardial infarction, stroke, or cardiovascular death. Patients were categorized as having increased cardiovascular risk when percentage values were equal to or greater than 10% (classified as high, very high, or critical risk).
The distribution of variables was evaluated using the Shapiro-Wilk test. The data were presented as mean ± standard deviation, median (interquartile range [IQR]), or absolute and relative frequency (%), as appropriate.
For the analyses, the categories of “excellent,” “very good,” and “good” were combined into “adequate intake,” while the categories of “poor” and “very poor” were grouped into “needs to improve intake.” This grouping was applied both in the self-perception of patients and in the nutritionist's assessment.
A Chi-square test was employed to compare the proportion of patients classified as having adequate intake based on self-perception and the nutritionist's assessment. The agreement between the patient’s self-perception and the nutritionist’s assessment was evaluated using the Kappa coefficient. Positive and negative predictive values were estimated, considering the proportion of patients classified as having “adequate intake” and confirmed by the nutritionist, as well as the proportion of patients classified as needing to improve intake and confirmed by the nutritionist, respectively.
The graph area was estimated as described in the Supplementary Material. Spearman's correlation coefficient was calculated for the total graphic area based on the patient’s self-perception compared to the nutritionist’s assessment. An analysis of concordance between the patient’s self-perception and the nutritionist’s assessment was conducted using the Bland–Altman plot method [25], which assesses the mean difference between two methods and considers the variability in these differences among individuals.
Poisson regressions were performed to investigate the associations between adequate intake as perceived by the patient and the nutritionist’s assessment. The first analysis (Model 1) was adjusted for age, with female as the reference category, and medium-/low-income. The second analysis (Model 2) additionally adjusted for the presence of obesity.
All data analyses were performed in PASW Statistics 18.0 (SPSS Inc., Chicago, IL), and the type I error rate was set at 5% (two-tailed).
A total of 336 patients were initially eligible for the study. However, six patients were excluded due to Implausible dietary intake information. Consequently, the final study cohort comprised 330 patients (refer to figure 2), and their characteristics are presented in table 1. The mean age of the patients was 56.62 ± 11.23 years, with an average BMI of 30.65 ± 4.48 kg/m². The majority were female (64.8%), and 48.5% self-identified as White. Hypertension was prevalent in 91.2% of patients, and more than half had a diagnosis of type 2 diabetes mellitus (58.5%) with a median HbA1c value of 8.1 ± 1.7%. Geographically, most patients resided in the South and Southeast regions (64.0%), followed by 24.5% in the North and Northeast, and 11.5% in the Midwest.
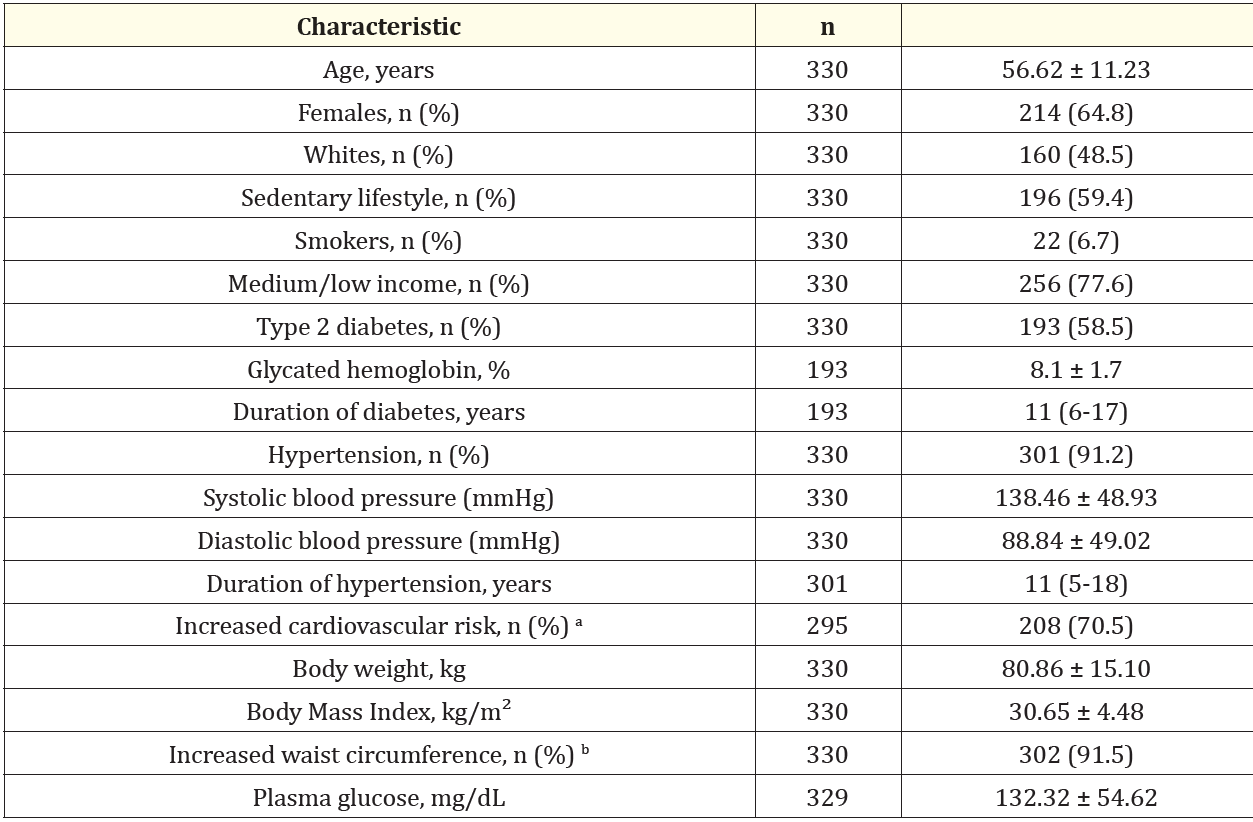
Table 1: Demographic, Anthropometric, and Clinical Characteristics of 330 Patients with diagnosis of uncontrolled Hypertension or Type 2 Diabetes.
Regarding dietary intake assessed by FFQs, patients reported a mean total calorie intake of 1,520 ± 624 kcal/day. The median distribution of macronutrients included 49.6% of total energy intake from carbohydrates, 21.0% from protein, 30.9% from lipids, and an average fiber intake of 18 g/day.
The proportion of the patient’s self-classification for Adequate Intake and by the nutritionist’s assessment for each component of the Wheel of Cardiovascular Health Diet is shown in figure S3. The greater differences (>20%) between the patient’s self-perception and the nutritionist’s assessment were observed in red meat, fruits, vegetables, dairy, processed meat, and whole grains.
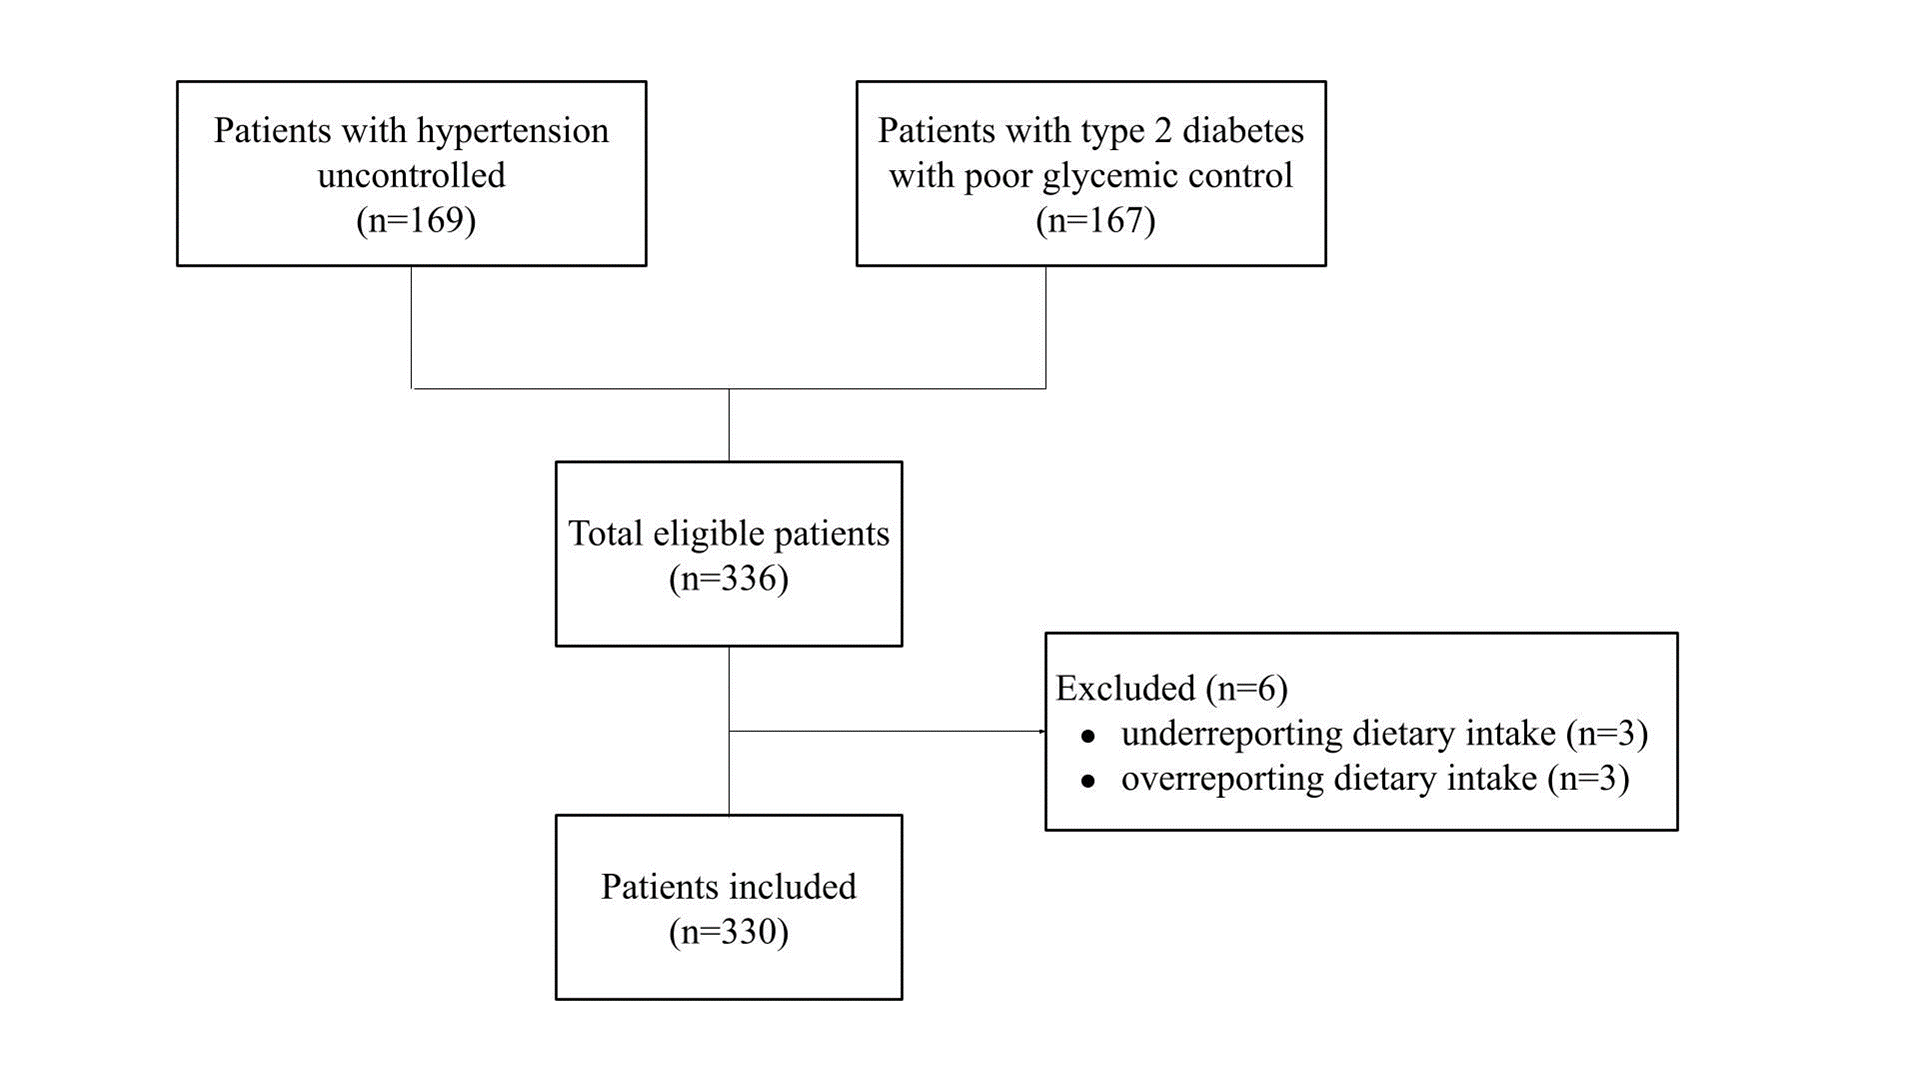
Figure 2: Flowchart of the patients inclusion with diagnosis of uncontrolled hypertension or type 2.diabetes.
Table 2 shows estimated kappa coefficients, positive and negative predictive values. The agreement between the patient’s self-perception and the nutritionist’s assessment was moderate for seeds/nuts (κ = 0.463) group and regular for the fruits (κ = 0.280), fish (κ = 0.302), beans (κ = 0.388) and sugar-sweetened beverages (κ = 0.266) groups; p < 0.001 for all analyses. The other components of the Wheel of Cardiovascular Health Diet (red meat, vegetables, UPFs, and whole grains) showed significant (p < 0.05) but weak agreements (k = 0.081 to 0.199). The processed meat group showed no significant difference. The proportion of patients who self-classified as “adequate intake”-information confirmed by the nutritionist-(positive predictive values) was 99.6% for the processed meat group, 88.3% for the beans group and 79.1% for the sugar-sweetened beverages group. The other components of the Wheel of Cardiovascular Health Diet (red meat, fish, seeds and nuts, fruits, vegetables, UPFs, dairy and whole grains) showed positive predictive values of less than 75%. The proportion of patients who self-classified as needs to “needs to improve intake”- information confirmed by the nutritionist-(negative predictive values) was 84.8% for red meat, 92.5% for fish, 93.3% for seeds and nuts, 88.3% for fruits, 100% for vegetables, 90.4% for dairy, and 100% for whole grains group. UPFs, processed meat, beans, and sugar-sweetened beverages showed negative predictive values of less than 75%.
Table 3 shows the models of Poisson Regression. We observed a positive association between Adequate Intake by self-report with the nutritionist evaluation of almost all components of the Wheel of Cardiovascular Health Diet, after adjustment for age, sex, and medium-/low-income, or presence of obesity. Just processed meat group showed no association.
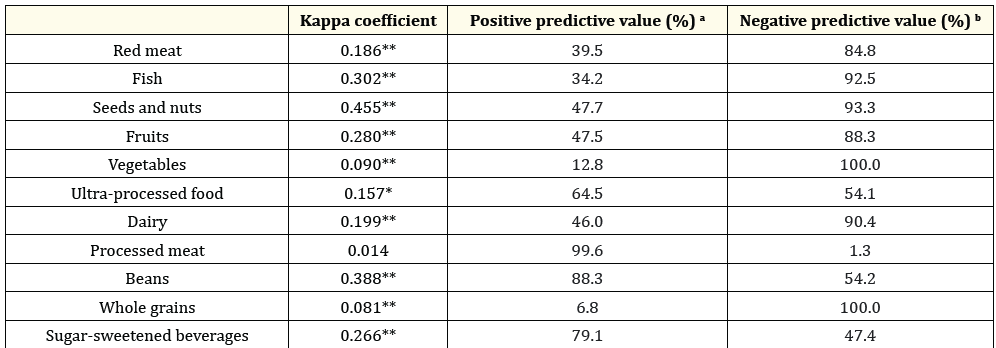
Table 2: Concordance of adequate intake by Wheel of Cardiovascular Health Diet according to patients’ self-perception and by the nutritionist’s
assessment (n = 330).
*P < 0.05; **P < 0.001. a Positive predictive value is the proportion of patients’ self-perception with “adequate consumption” confirmed
by the nutritionist assessment. b Negative predictive value is the proportion of patients’ self-perception that needs to improve intake
confirmed by nutritionist assessment.
The total areas of the graph based on filling in the Wheel of Cardiovascular Health Diet of each patient (patient’s self-perception and nutritionist’s assessment) were performed. The mean of the graph area based on filling in the Wheel of Cardiovascular Health Diet by the patient’s perception was 61.01 ± 12.54% and by the nutritionist was 51.72 ± 9.93%. Spearman’s correlation coefficients according to sex were estimated (Figure 3, panel A). We observed moderate correlation in females (𝞪 = 0.52) and in males (𝞪 = 0.48); p < 0.01 for both analyses. We also observed moderate correlation (𝞪 = 0.47 to 0.56; p < 0.01) in subgroup analyses: individuals with or without obesity, older people, and medium-/low-income (data not shown). Moreover, the agreement between the total areas was evaluated by the Bland-Altman plot method (Figure 3, panel B). The mean difference (agreement range) observed between the percentage of the graph area evaluated by the patient’s self-perception in relation to the nutritionist’s assessment was 9.3% (95%CI-13.2, 31.8; p < 0.01). In subgroup analyses, the mean differences observed were: 10.1% in adults (95%CI-11.4, 31.6), 8.1% in older people (95%CI-15.6, 31.8), 9.2% in females (95%CI-13.6, 32.1), 9.4% in males (95%CI-12.7, 31.5), 9.2% in patients with obesity (95%CI-12.9, 31.3), 9.4% in patients without obesity (95%CI-13.7, 32.5), and 8.8% in medium-/low-income patients (95%CI-13.9, 31.5); p < 0.01 for all analyses.
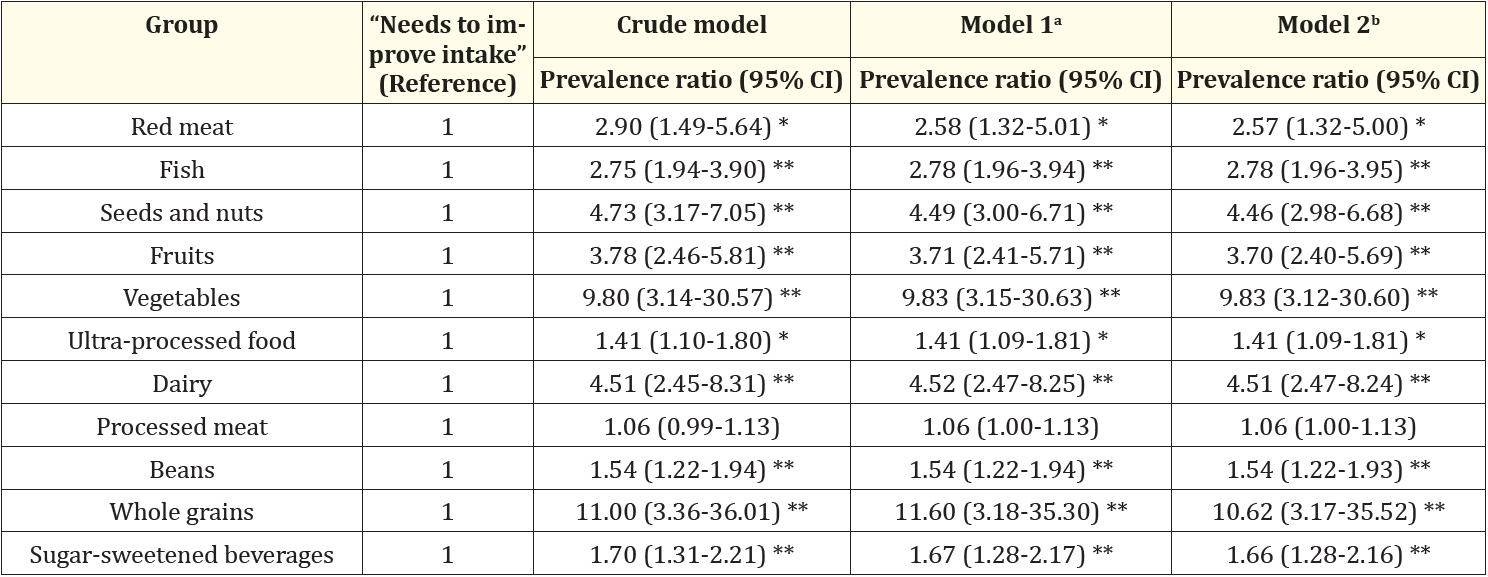
Table 3: Poisson Regression Models to evaluate the association between patients’ self-perception to “adequate intake” according to the
Wheel of Cardiovascular Health Diet with the confirmation of adequate intake by the nutritionist’s assessment (dependent variable); n =
330.
*P < 0.05; **P < 0.001. a Model 1 was adjusted for age, sex (female as reference), and medium/low income. b Model 2 was adjusted for age,
sex (female as reference), medium/low income, and presence of obesity.
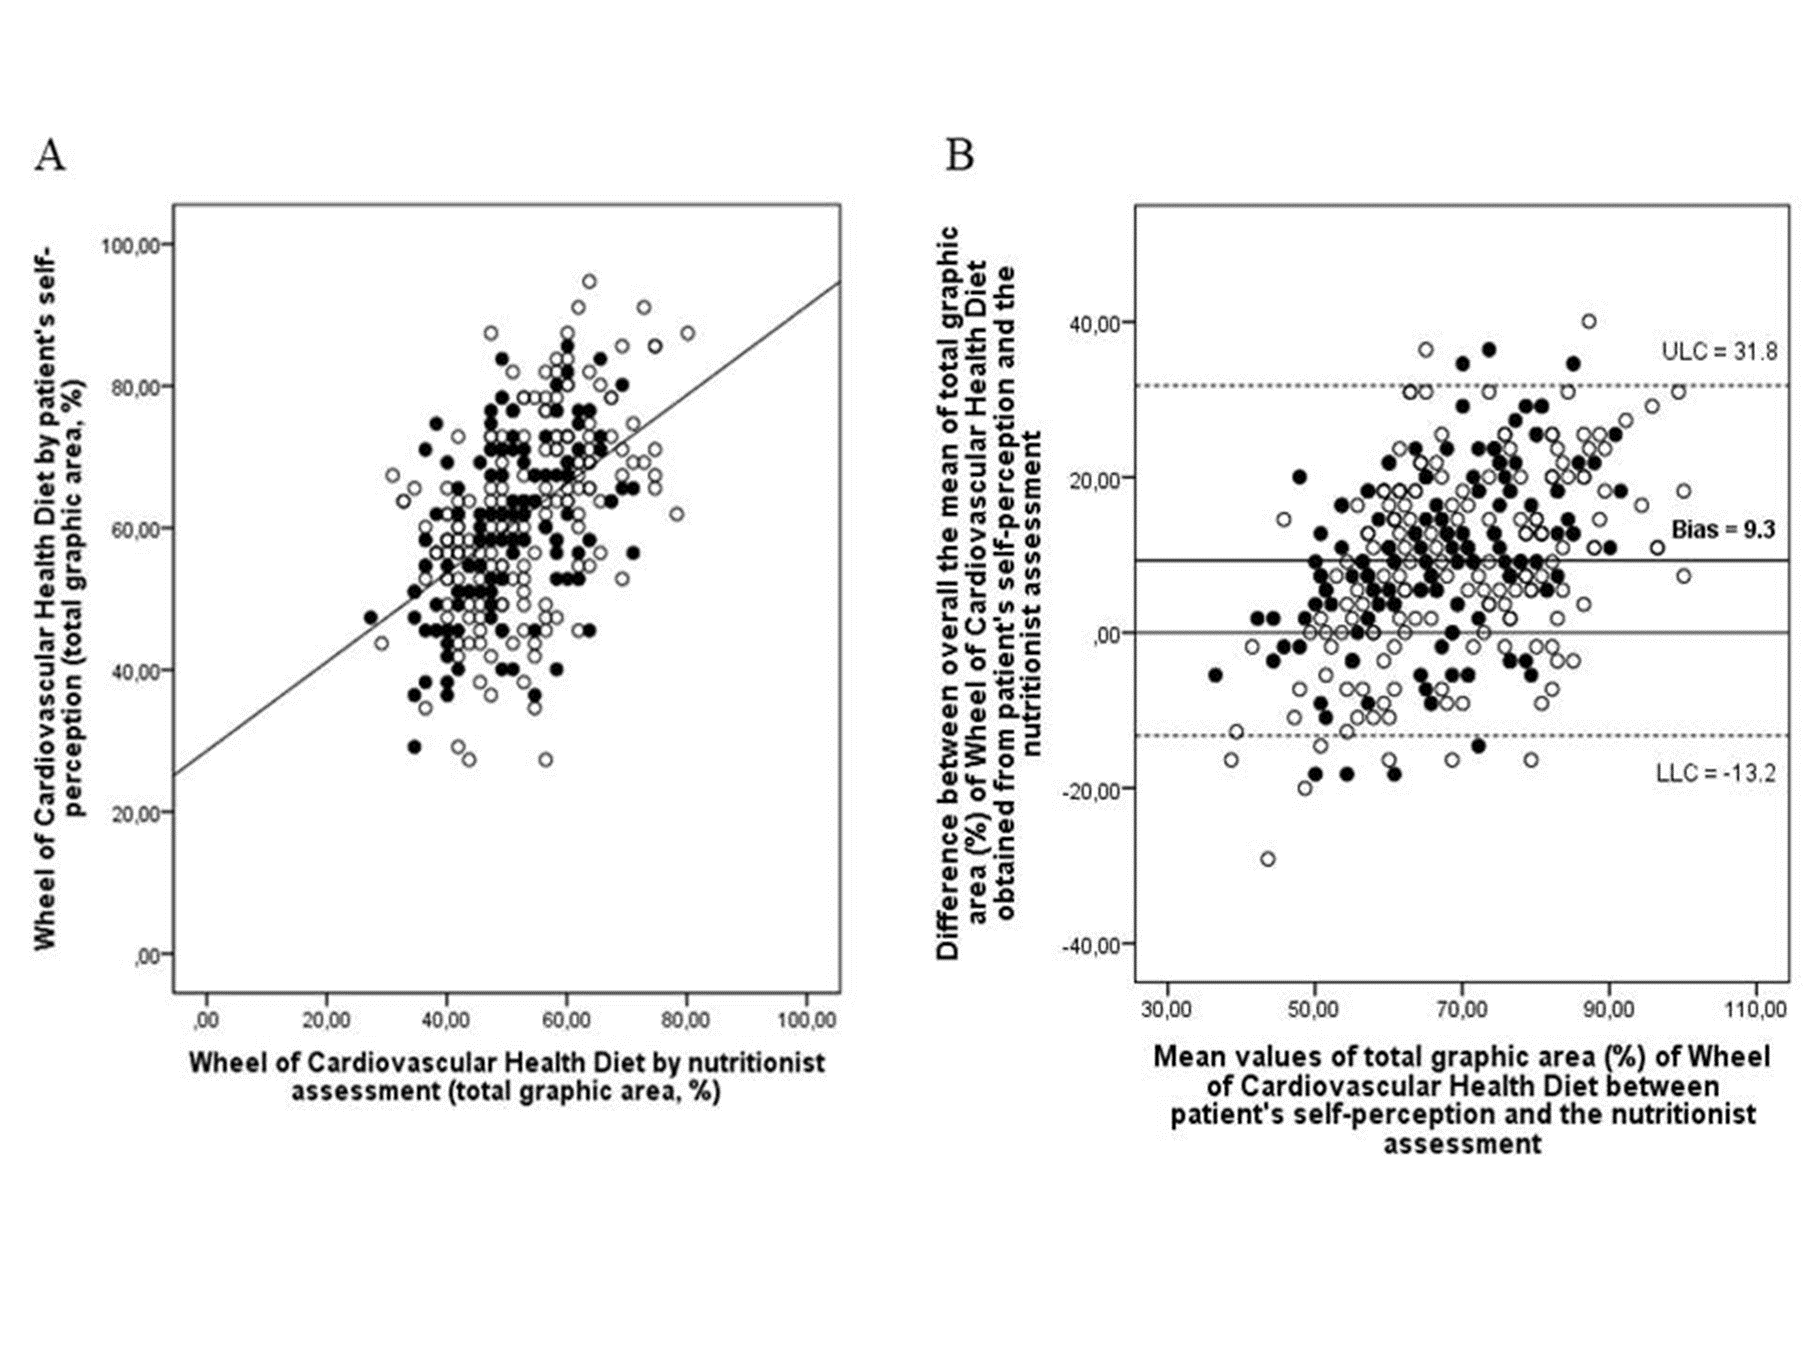
Figure 3: Dispersion plot of the total graphic area (%) of Wheel of Cardiovascular Health Diet according to self-perception of the patient and by nutritionist assessment and Bland–Altman analysis of the differences between the mean of total graphic area (%) of Wheel of Cardiovascular Health Diet by patient's self-perception compared with the nutritionist assessment (n = 330). Black dots are male values and white dots are female values. Panel A: Spearman's coefficients correlation were moderates in females (𝞪 = 0.52) and also in males (𝞪= 0.48); P < 0.01 for both analyses. Panel B: The solid line represents the mean value of the difference between the patient's self-perception and nutritionist assessment. Dotted lines represent the limit of agreement, where LLC is the lower limit of concordance and ULC is the upper limit of concordance.
This study compared the information of diet quality based on the patient’s self-perception with the nutritionist’s assessment in the Wheel of Cardiovascular Health Diet. The mean difference between the percentage of the graph area evaluated by the patient’s self-perception in relation to the nutritionist’s assessment was 9.3% (95%CI-13.2 to 31.8). Among the main results of this study, we observed a positive association between adequate consumption by self-report with the nutritionist evaluation of almost all components of the Wheel of Cardiovascular Health Diet, after adjustment for confounders. Moreover, we observed higher negative predictive values for red meat, fish, seeds and nuts, fruits, vegetables, dairy, and whole grains and higher positive predictive values for the processed meat, beans, and sugar-sweetened beverages groups. A moderate agreement between the nutritionist’s assessment and the patient’s self-perception was observed for the seeds/nuts groups and regular for the fruits, fish, beans, and sugar-sweetened beverages groups. We observed greater differences (>20%) between self-perception and nutritionist’s assessment in red meat, fruits, vegetables, dairy, processed meat, and whole grains.
This study has some limitations and strengths. Patients were selected to participate in a randomized clinical trial and therefore do not represent the general population. In cross-sectional design the assessment is carried out in a single moment, so it is possible that individuals with a self-perception of adequate intake have made recent changes and that this consumption is not long-standing. The FFQ is memory dependent, it can become tiring due to the number of items and also the difficulty in accurately measuring the amount consumed. In addition, in relation to food intake, individuals can answer what they believe to be more appropriate, especially when questioned by a professional. However, the Wheel of Cardiovascular Health Diet is an unprecedented instrument that assesses food intake by food groups and not just by nutrient content. The dietary patterns analysis has an advantage over the analysis of isolated nutrients and it is important since people do not ingest isolated nutrients. People’s meals are composed of many foods with complex nutrient combinations. As far as we know, the Cardiovascular Health Diet Index is the only index that includes components such as UPFs [7], which have been extensively studied in recent years and are known to be associated with a lower quality of the diet, a higher risk of cardiovascular diseases and mortality [26,27]. In addition, this tool makes it easier for the population to interpret or translate the information into diets diets [2]. Another advantage of this new tool is the practicality of application, it is simple, fast, and didactic, as patients can visualize (by images) the food groups and their recommended portions. Furthermore, as a self-applied tool, it minimizes interviewer bias, because behavioral factors, such as the words used to ask the questions, reactions to patients’ answers, and omissions of questions, can influence the answers and introduce errors [28]. This instrument was based on a tool used in coaching processes. Health coaching is intended to facilitate healthy and sustainable behavior change by educating and supporting patients to achieve their health goals via lifestyle and behavior changes. This process encourages patients to explore their inner strengths, building their confidence and making improvements [29]. Considering that the patient should be at the center of care and decisions related to the lifestyle change process, we should understand that change is best made when it is self-directed and autonomously motivated and is generally resisted when suggested by others [30].
Our study showed positive association between adequate consumption by self-report with the nutritionist’s assessment in the Wheel of Cardiovascular Health Diet. Considering that this is an unprecedented tool, it is difficult to compare our results with other studies. In a cross-sectional study with 1,243 individuals, Machado., et al. [31] also observed that positive self-perception of food was associated with most indicators of adequate food. In addition, Powell-Wiley., et al. [32] observed that participants with high perceived diet quality also had higher scores on the assessed dietary index in a cross-sectional study with 4,419 patients. The Wheel of Cardiovascular Health Diet seems to be a good tool for diet self-assessment. After all, if the patient recognizes that they meet the recommendation, they are more likely to continue with the adequate intake.
Most food groups on the Wheel of Cardiovascular Health Diet had higher negative predictive values. That is, most patients who self-classified as “needs to improve intake” in the food groups had this information confirmed by the nutritionist. Our findings are corroborated by a cross-sectional study with 374 university students. In it, Souza and Backes [33] evaluated the self-perception of food consumption and adherence to the Ten Steps to Adequate and Healthy Eating in the Food Guide for the Brazilian Population. They observed that students who do not consider eating healthy had poor eating habits, presenting adherence above 60% for just one step. This way, we could observe that patients have a greater discernment about what they cannot do or what is not adequate, because they perceive more the food groups that they do not reach the recommendation or when their diet is unhealthy. However, negative self-perception of diet can raise awareness and stimulate behavioral changes and the adoption of better eating habits [31].
About positive predictive values, only three food groups had higher values. Some studies have shown that people tend to overrate their dietary quality, perceiving or grading their diets as healthier than what they actually are. In a study with 2,862 individuals from the 1989-90 Continuing Survey of Food Intake by Individuals and the Diet and Health Knowledge Survey, Variyam., et al. [34] observed that self-perception of diet quality and estimated diet quality assessed with the Healthy Eating Index showed that 40% of respondents perceived their diet to be healthier than it actually was. Similarly, Powell-Wiley., et al. [32] observed that the participants perceived their diet quality as being high had a DASH index score of three out of a maximum of nine and Batis., et al. [35] observed that the score was 40 out of 100 possible points for the assessed dietary index. Still, individuals who perceived diet quality as high or good had higher diet quality (assessed with diet indices) compared to those who perceived their diet quality as low or poor.
Moderate agreement between the patient’s self-perception and nutritionist’s assessment was observed for one group and regular for four groups. Differences in self-perception of diet can occur for many reasons, including cultural differences, like different considerations as to what is adequate, according to countries and cultures, and time differences, due to different periods in which studies are conducted. Thus, it is important to define an adequate diet according to the variability of the concept over time, the aforementioned reasons, and their influence on what each person considers being adequate in terms of their own diet [31]. Therefore, studies of self-perception of dietary quality and actual dietary intake are important because they can potentially show the disconnect between these in the population [35].
It's encouraging to see positive associations between patients' self-reported consumption and the nutritionist's assessment in various components of the Wheel of Cardiovascular Health Diet. The tool's potential to serve as a self-assessment and nutritional counseling aid, while placing the patient at the center of care, is valuable. The focus on promoting self-awareness of dietary habits can contribute to patient engagement in managing their health. Certainly, acknowledging the need for further studies to assess the validity of the Wheel of Cardiovascular Health Diet in predicting diet quality compared to other indices and its impact on clinical outcomes is a prudent approach. Conducting additional research will help validate and refine the tool, ensuring its effectiveness and reliability in diverse populations and clinical settings.
The multicenter clinical trials studies were funded by Hcor in partnership with the Programa de Apoio ao Desenvolvimento Institucional do Sistema Único de Saúde (PROADI-SUS/Brazilian Ministry of Health). This study was supported by the Fundo de Incentivo à Pesquisa e Evento (FIPE/HCPA) of the Hospital de Clínicas de Porto Alegre (ID 2019-0644). This study was partly financed by the Coordenação de Aperfeiçoamento de Pessoal de Nível Superior – Brasil (CAPES; Finance Code 001), Edital 05/2019 Pesquisador Gaúcho FAPERGS (19/2551-0001858-4), and Conselho Nacional de Desenvolvimento Científico e Tecnológico (CNPQ).
There are no conflicts of interest.
CCRR, ACB-F, AM, DMLM, and JCA contributed to the elaboration and development of the Wheel of Cardiovascular Health Diet. CCRR, TAS, and ACB-F contributed to data collection and interpretation. VSC, BPR, and JCA contributed to the statistical analysis. VSC, JCA, DMLM, and AM contributed to the interpretation of results. VSC wrote the manuscript and JCA mentored. VSC, BPR, DMLM, and AM reviewed the manuscript critically. All authors read and approved the final manuscript.
To estimate the area of the Wheel of Cardiovascular Health Diet graph, we considered that the graph represents a circle, and that each scoring item represents 1 cm. To estimate it, we used the following criteria: initially we estimated the value of the total area of the graph, the graph area of a circle is “π × radius of the circle²,” in the Wheel of Cardiovascular Health Diet the radius of the circle = 5, thinking there are 5 scoring items. Thus, to estimate the area of the graph we made “3.14 x 5² = 78.5.” From there, we identified the area of each group, and each item’s score gap. To identify each person’s score, we excluded items that were incompletely scored from the total area. We estimated the area corresponding to each of the 11 groups (78.5/11 = 7.14); the value of the area of each group was divided by 5, the maximum value that can be scored, and the result is the value of the area of each punctuation gap of the food group sub-item (7.14/5 = 1.43); if the participant scored 5 for a group, for example, the area he filled in that group will be 5 x 1.43 (area of each sub-item), this estimation was performed for all food groups and the values summed, obtaining a final total result (e.g.: total graph area of 57.2); and, finally, to know the percentage of the area of the graph filled, we performed the rule of three estimation (57.2 x 100/78.5 = 72.86%).
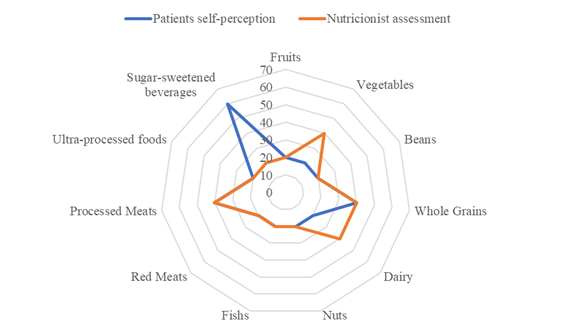
Figure S1: Graph area of the Wheel of Cardiovascular Health Diet with the highest agreement between patient self-perception and nutritionist assessment.
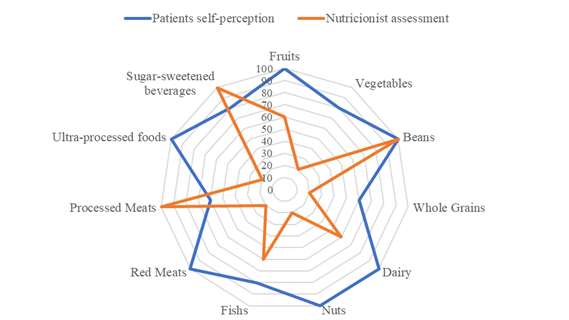
Figure S2: Graph area of the Wheel of Cardiovascular Health Diet with the lowest agreement between patient self-perception and nutritionist assessment.
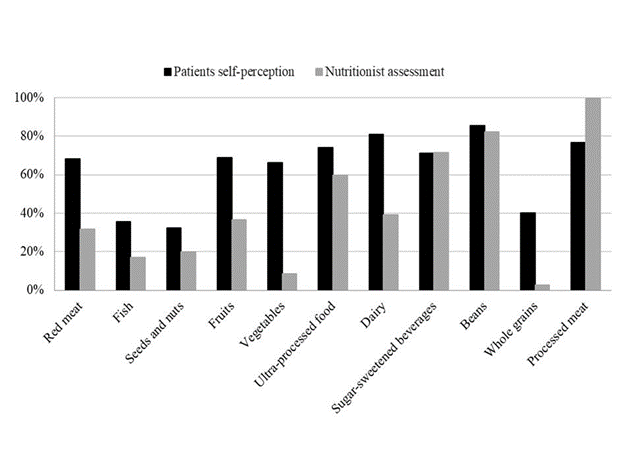
Figure S3: Proportion of 330 patients classified as “Adequate Consumption” by the Wheel of Cardiovascular Health Diet according to patients’ self-perception (black bars) and by the nutritionist assessment (gray bars).
Copyright: © 2024 Jussara Carnevale de Almeida., et al. This is an open-access article distributed under the terms of the Creative Commons Attribution License, which permits unrestricted use, distribution, and reproduction in any medium, provided the original author and source are credited.
 Open Access by
Acta Scientific is licensed under a Creative Commons Attribution 4.0 International License
Open Access by
Acta Scientific is licensed under a Creative Commons Attribution 4.0 International License
Based on a work at https://actascientific.com
ff


