João Felipe de Brites Senra1, Rosana Gomes de Oliveira2, Idalina Sturião Milheiros1, Marlon Dutra Degli Esposti1, Viviane Alexia Correia Silva2*, Isabela Bolari Ramos2, Marcone Comério3 and Rodolfo Ferreira de Mendonça3
1 Instituto Capixaba de Pesquisa, Assistência Técnica e Extensão Rural/Centro de Pesquisa Desenvolvimento e Inovação Sul - Fazenda Experimental Bananal do Norte-Cachoeiro de Itapemirim, ES, Brasil
2Universidade Federal do Espírito Santo-Programa de Pós-Graduação em Genética e Melhoramento Vegetal- Alegre, ES, Brasil
3Instituto Capixaba de Pesquisa, Assistência Técnica e Extensão Rural-Fazenda Experimental de Marilândia- Marilândia, ES, Brasil
*Corresponding Author: Viviane Alexia Correia Silva, Universidade Federal do Espírito Santo-Programa de Pós-Graduação em Genética e Melhoramento Vegetal- Alegre, ES, Brasil.
Received: June 28, 2024; Published: August 14, 2024
Citation: Viviane Alexia Correia Silva., et al. “Characterization Of Coffea canephora Clones And Analysis Of Genetic Correlations". Acta Scientific Nutritional Health 8.9 (2024): 25-33.
The aim was to characterize Coffea canephora clones from Incaper active germplasm bank (BAG), analysing morphoagronomic characteristics and investigating genetic correlations to improve indirect selection. The BAG, at the Bananal do Norte Experimental Farm in Cachoeiro de Itapemirim, ES, was set up in 2017 with 500 accessions. In 2019 and 2020, 217 accessions were evaluated for 17 traits, including plant shape, uniformity of maturity, fruit size, vigor, reaction to pests and diseases, and post-harvest yield parameters. Using the REML/BLUP method in the Selegen software and genetic correlations in the R software, genetic variability, resistance to pests/diseases, and genotypes with high yields were identified. Indirect selection was feasible, prioritizing correlated traits such as size, general scale, vigor and fruit size. Genotypes 139, 211, 287, 410, 411, 422 and 436 stood out in multiple aspects, indicating potential for the formation of varieties or controlled crosses.
Keywords: Selection; Indirect Selection; Mixed Models; Conilon/Robusta Coffee Farming
BAG: Active Germplasm Bank; Incaper: Instituto Capixaba de Pesquisa, Assistência Técnica e Extensão Rural; Aw: Tropical Climate with a Dry Season; FS: Fruit Size; UM: Uniformity of Fruit Ripening; YP: Yield Per Plant; PS: Plant Size; VV: Vegetative Vigor; IR: Incidence of Rust; IC: Incidence of Cercospora Leaf Spot; DB: Drying Out of Plagiotropic Branches; GS: General Scale; IMI: Incidence of Mining Insects; DI: Degree of Inclination; ICR: Incidence of Citrus Mealybug; TS: Top Sieve; BS: Bottom Sieve; CF: Coconut Fruits; PF: Pounding Grains; REML: Restricted Maximum Likelihood; BLUP: Best Unbiased Linear Prediction; LRT: Likelihood Ratio Test
Coffee growing is one of the main agricultural activities in the world and is carried out by the most diverse groups of farmers, ranging from family farmers to large producers. It is estimated that more than 125 million small farmers in coffee-producing regions around the world earn direct or indirect income along the coffee production chain from cultivation to marketing [12]. Coffee species belong to the genus Coffea of the Rubiaceae family and are grown mainly in tropical regions of the globe [4,15]. The species Coffea canephora Pierre ex A. Froehner is native to lowland African rainforests stretching from Guinea in West Africa across the Congo River Basin to Uganda in East Africa [8]. The genus has 130 known species [9] and the coffee market is centered on the species, Coffea arabica (arabica coffee tree) and Coffea canephora (conilon/robusta coffee tree).
Coffea canephora is a diploid species (2n = 22) with cross-pollination [2] and compared to arabica coffee tree, conilon coffee tree has higher productivity, higher caffeine content, superior development at lower altitudes and better tolerance to biotic and abiotic stresses [7]. In order to develop new varieties, it is necessary to exploit ample genetic variability with properly identified genotypes for direct selection and evaluation in competition trials or the design of controlled crosses to optimize heterosis. Clonal evaluation is a methodology used in many breeding programs to assess genetic variability and select high-yielding clones [29,33]. Superior clones are fundamental in breeding programs for the formation of hybrid cultivars and/or direct variety formation [2]. The lack of information on the agronomic and genetic parameters of the clones under study makes it difficult to select them and incorporate them into breeding programs [2].
The continuous development of coffee varieties requires that the sources of genetic variation within and between genotypes are correctly estimated [16]. In any crop improvement program, knowing the genetic properties of the target traits and their associations is a prerequisite for establishing a successful selection program [2]. Correlation estimates in plant breeding are important because they can help detect associations between target traits, identify new parental combinations in the development of improved varieties, and identify redundancy in trait measurements [37].
Therefore, given the need to optimize the process of developing new varieties of Coffea canephora, this work aimed to characterize genotypes from Incaper active germplasm bank in relation to 17 morphoagronomic characteristics relating to production, reaction to pests and diseases and post-harvest yield parameters, as well as estimating the genetic correlations between these characteristics in order to optimize future selection processes through indirect selection.
The data collection of this work took place in the Active Germplasm Bank (BAG) established in the Bananal do Norte experimental farm of Incaper, located in the municipality of Cachoeiro de Itapemirim, in the state of Espírito Santo, Brazil (20º45'S, 41º17'W) at 140 meters of altitude. The climate of the region is classified as Aw by Köppen-Geiger. The soil is classified as dystrophic Red-Yellow Latosol. The region presents annual rainfall of 1,200 mm, an average annual temperature of 23 °C and undulating topography.
The BAG was planted in this location in May 2017, at a spacing of three meters between lines and 1.5 meters between plants with 500 accessions and three plants for accession, surrounded by a borderline with different genotypes. Fertilization management follows the recommendation of the fertilization and liming manual for the State of Espírito Santo [23]. Cultural and phytosanitary management were carried out according to the requirement of the crop following the current recommendations for conilon coffee tree [13].
In years, 2020 and 2021 217 BAG accessions (genotypes) were evaluated in relation to 17 agronomic characteristics described below
Data analysis was obtained by using the restricted maximum likelihood method and best unbiased linear prediction (REML/BLUP), and the Selegen software [26], applying the basic repeatability model without delineation
Where y is the data vector, m vector of measurement effects (fixed) added to the general average, p is the vector of permanent plant effects, genotypic effect plus permanent environmental effect (random) and e is the vector of residuals (random). The capital letters represent the incidence matrices for these effects.
Based on this model the variance components were estimated: () permanent phenotypic variance between plants (genotypic + environmental from one crop to another); () temporary environment variance; () individual phenotypic variance; (ρ) individual repeatability; (ρm) repeatability of the average of m harvests; (Acm) selection accuracy based on the average of m harvests; (μ) overall experiment average.
The significance of the random effect of the statistical model was tested by deviance analysis using the likelihood ratio test (LRT) according to the following expression
Where, Log L is the logarithm of the maximum (L) of the restricted likelihood function of the full model; and Log LR is the logarithm of the maximum (LR) of the restricted likelihood function of the reduced model (without the effect being evaluated). The LRT was analyzed considering the chi-square test with a degree of freedom at 1, 5 and 10 % of significance.
Based on the estimated genetic values, the ten best genotypes for each trait were identified. A genetic correlation analysis was carried out for the traits under study. Estimates of the genetic values, variance components and significance of the effects were carried out using the selegen software [26]. The genetic correlations were carried out in the R software [25] in the 'PerformanceAnalytics' package [23].
The estimated variance components and the genotypic average of the characteristics evaluated are shown in Table 1. The lowest accuracy and average repeatability values were for the IMI trait and the highest values for PH. According to the classification proposed by [27], the FS, TS, BS, IR and PH traits have high accuracy, PF, DI, GS, IC, YP and VV moderate accuracy and the others low accuracy. According to the classification proposed by the same authors, average repeatability can be described as high for the IR and PH traits, moderate for PF, DI, GS, IC, YP, VV, FS, TS and BS and low for the others.
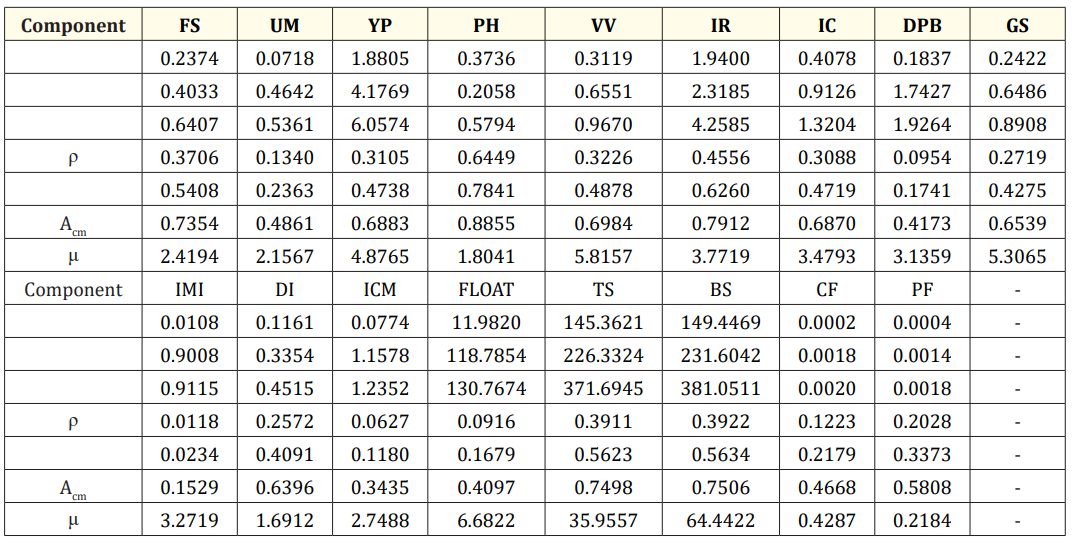
Table 1: Estimates of variance components genetic and environmental parameters for the following characteristics: Fruit size (FS), Uniformity of fruit ripening (UM), Yield per plant (YP), Plant size (PS), Vegetative vigor (VV), Incidence of rust (IR), Incidence of cercospora leaf spot (IC), Drying out of plagiotropic branches (DB), General scale (GS), Incidence of mining insects (IMI), Degree of inclination (DI), Incidence of citrus mealybug (ICR), Percentage of fruit float (Float), Top sieve (TS), Bottom sieve (BS), Yield of ratio field fruits for coconut fruits (CF) and ratio field fruits for pounding grains (PF). Permanent phenotypic variance between plants (genotypic + environmental from one crop to another); : temporary environment variance; : individual phenotypic variance; ρ: individual repeatability; : repeatability of the average of m harvests; Acm: selection accuracy based on the average of m harvests; μ: overall experiment average.
[1] studying populations of conilon coffee trees from the conilon, robusta and hybrid botanical groups, using a complete block design, estimated accuracy values of: 0.89, 0.87 and 0.05 for fruit size; 0.67, 0.59 and 0.55 for yield; 0.56, 0. 59 and 0.67 for plant size; 0.7, 0.58 and 0.6 for vegetative vigor; 0.86, 0.75 and 0.39 for rust incidence; and 0.78 and 0.75 for cercospora incidence in individuals from the conilon, robusta and hybrid groups respectively. The estimated accuracy of FS was higher than that obtained for the hybrid population. The YP and PH traits obtained higher accuracy values than those reported. The accuracy of VV and IR was close to the estimated value for the conilon population and higher than the estimates for the robust and hybrid populations. The accuracy of IC was lower than the reported results.
In a study of eight half-sibling families of Coffea canephora from Incaper recurrent selection program during the 2013 and 2014 harvests, accuracy values of 0.67 were estimated for grain size, 0.69 for yield, 0.73 for plant size, 0.47 for vegetative vigor and 0.70 for degree of plant inclination [5]. With the exception of the YP trait, which was slightly lower, the others stand out as higher than the values estimated by [4]. In a study on the intercropping of conilon coffee with banana (Musa sp.), pupunheira (Bactris gasipaes Kunth) and agroforestry systems with gliricidia (Gliricidia sepium Jacq. Steud) and ingá (Inga edulis Mart), accuracy values for productivity were estimated at 0.1878, 0.2396, 0.3624 and 0.3547, respectively [31]. The accuracy for the YP trait was 0.6883, a value 1.90 to 3.67 times higher than those obtained by [31] who used the same statistical design.
The Deviance analysis presented in Table 2 shows that the permanent phenotypic variance, which aggregates the genetic variance plus the permanent environmental variance from one harvest to the next, was significant for most of the traits under evaluation. Only the UM trait was significant at 5%, the DPB, IMI, ICM, FLOAT and CF traits were non-significant, and the others were significant at 1%. Based on the accuracy, average repeatability and Deviance values, it is possible to identify candidate genotypes in the database for controlled crosses and, or the composition of experimental trials to select clones for the formation of Coffea canephora varieties. Although the permanent phenotypic variance encompasses the genetic and environmental effects, it is still possible to make valuable inferences in the pre-breeding stage, in the process of identifying, classifying and selecting genotypes for various purposes. Significant effects of genetic parameters for coffee growing estimated by Deviance analysis are reported in the literature as in the works by [1,19,31,32].
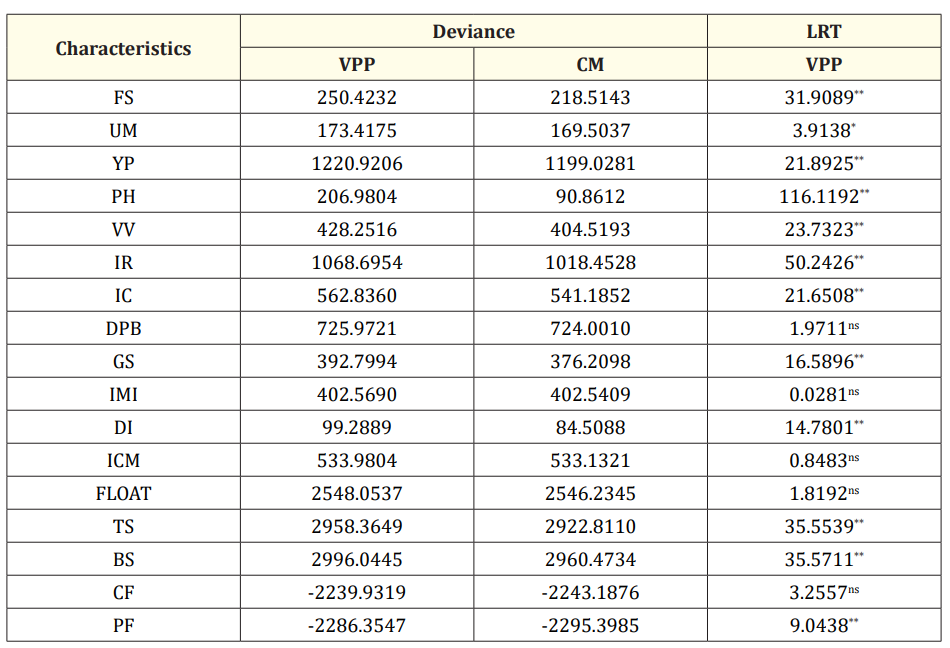
Table 2: Deviance and likelihood ratio test (LRT) for the following characteristics: Fruit size (FS), Uniformity of fruit ripening (UM), Yield per plant (YP), Plant size (PS), Vegetative vigor (VV), Incidence of rust (IR), Incidence of cercospora leaf spot (IC), Drying out of plagiotropic branches (DB), General scale (GS), Incidence of mining insects (IMI), Degree of inclination (DI), Incidence of citrus mealybug (ICR), Percentage of fruit float (Float), Top sieve (TS), Bottom sieve (BS), Yield of ratio field fruits for coconut fruits (CF) and ratio field fruits for pounding grains (PF). CM: complete model; VPP: permanent phenotypic variance. ns, * and **: not significant, significant at 5% and significant at 1%, respectively, based on the chi-square test with 1 degree of freedom.
The analysis of genetic correlations identified high values of associations between the traits evaluated, with significances of 0.1, 1 and 5%, as shown in Figure 1. The highest correlation value observed was between the traits CF and PF and VV and GS with a value of 0.67 at 0.1%. The second highest correlation value was 0.59 at 0.1% between YP and GS and the third highest correlation value was between the FS and TS characteristics, 0.53 at 0.1%. The lowest correlation value was -0.99 at 0.1% between the TS and BS traits. The second lowest correlation value was -0.57 at 0.1% between VV and DPB and the third lowest correlation value was -0.54 at 0.1% between GS and DPB. Significant effects of genetic correlations have been identified in other research with conilon coffee trees, as reported by other authors such as [2,10,11,32].
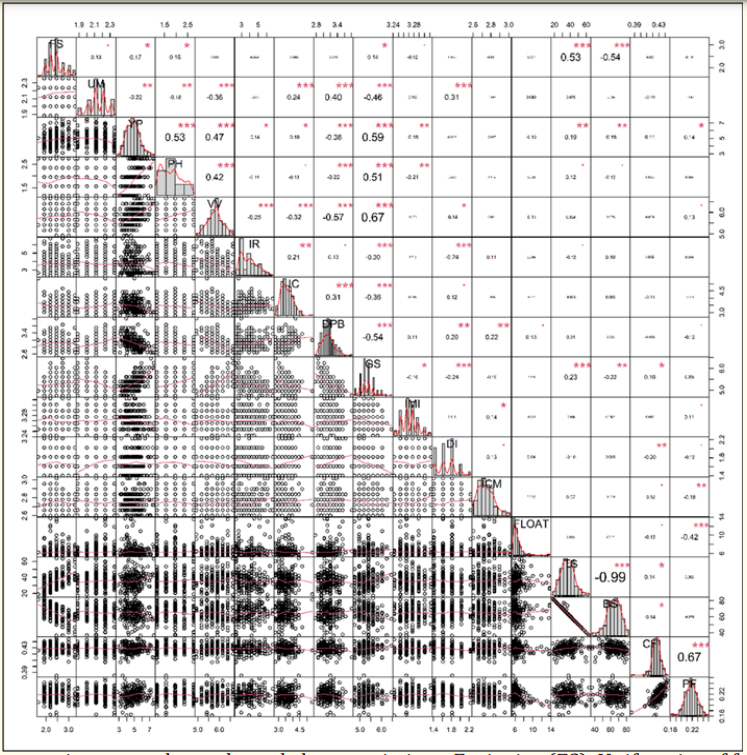
Figure 1: Genetic correlation matrix among the evaluated characteristics: : Fruit size (FS), Uniformity of fruit ripening (UM), Yield per plant (YP), Plant size (PS), Vegetative vigor (VV), Incidence of rust (IR), Incidence of cercospora leaf spot (IC), Drying out of plagiotropic branches (DB), General scale (GS), Incidence of mining insects (IMI), Degree of inclination (DI), Incidence of citrus mealybug (ICR), Percentage of fruit float (Float), Top sieve (TS), Bottom sieve (BS), Yield of ratio field fruits for coconut fruits (CF) and ratio field fruits for pounding grains (PF). °, *, ** and ***: significant at 10%, significant at 5%, significant at 1%, significant at 0.1% respectively.
These values indicate that indirect selection is a viable option for genetic improvement of the conilon coffee tree, with a strong emphasis on the GS trait. By selecting genotypes based on an ideal phenotype, which is proposed by this trait, the breeder is indirectly selecting coffee trees with larger fruit size, better uniformity of ripening, high fruit production per plant, higher size, superior vigor and lower incidence of pests and diseases. At the same time, it can be seen that there is a correlation that could be explored between the size of the fruit identified in the field and the percentage of beans with a higher sieve. Another association between traits suitable for indirect selection is the genetic correlation between IR and IC, of 0.21 at 1% significance. Other studies have already shown a positive genetic correlation between rust (H. vastatrix) and cercospora (C. coffeicola), as in the work by [20].
The process of developing new varieties implies the need to know the relationship between the characteristics under study [21]. Genetic correlation optimizes the indirect selection process [28]. Another advantage of using correlations is the elimination of redundant characteristics. It is emphasized that morphological and biometric data are useful for breeding programs [17,35]. Following this line of reasoning in the construction of selection indices for conilon coffee, greater weight should be given to YP, GS and FS, as they will provide indirect gains for other important traits. Additionally, the BS trait can be discarded, as it is redundant with TS.
The PH and VV traits should also be prioritized when designing the indices, as they were correlated with YP and GS. Among the morphological characteristics studied in coffee growing, plant height and vegetative vigor are the most closely related to production [2,3,22,34]. The height of the coffee tree and the canopy has been shown to have a positive correlation with important characteristics such as the total leaf area of the plant, the volume of the canopy and the leaf area index [32]. [10] estimated a correlation of 0.333 between plant yield and plant height in a study evaluating half-sibling families of Coffea canephora in Ghana.
By applying the BLUP methodology to each trait under study, a selection index is simultaneously obtained by ranking the genotypes based on their genetic values (Table 3). Among the genotypes highlighted as superior for the traits under study, it can be seen that some were selected as superior for more than one trait (Table 4). Genotypes 139, 211, 287, 410, 411, 422 and 436 are those that stood out in at least four characteristics. A major highlight was genotype 422, which was superior in seven of the 17 characteristics evaluated. Based on the results in Tables 3 and 4, it will be possible to guide controlled crosses in Coffea canephora with the aim of developing productive varieties with large grains, resistant to pests and diseases and with a good post-harvest yield. There is therefore a large source of genetic variability to be exploited by Incaper, either to create new genotypic combinations through controlled crosses or to create new varieties through clonal selection. Incaper genetic variability has already been demonstrated by other authors [14,30].
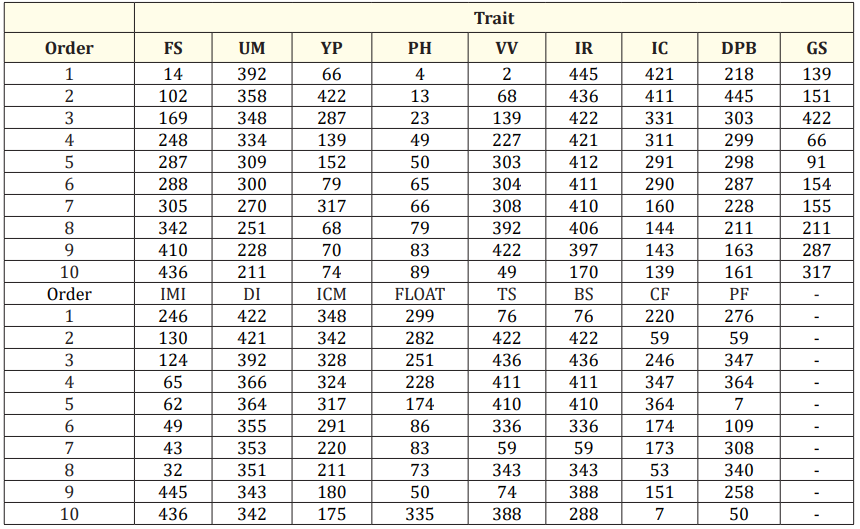
Table 3: Classification of the ten best genotypes based on the best unbiased linear prediction methodology for the following characteristics: Fruit size (FS), Uniformity of fruit ripening (UM), Yield per plant (YP), Plant size (PS), Vegetative vigor (VV), Incidence of rust (IR), Incidence of cercospora leaf spot (IC), Drying out of plagiotropic branches (DB), General scale (GS), Incidence of mining insects (IMI), Degree of inclination (DI), Incidence of citrus mealybug (ICR), Percentage of fruit float (Float), Top sieve (TS), Bottom sieve (BS), Yield of ratio field fruits for coconut fruits (CF) and ratio field fruits for pounding grains (PF).
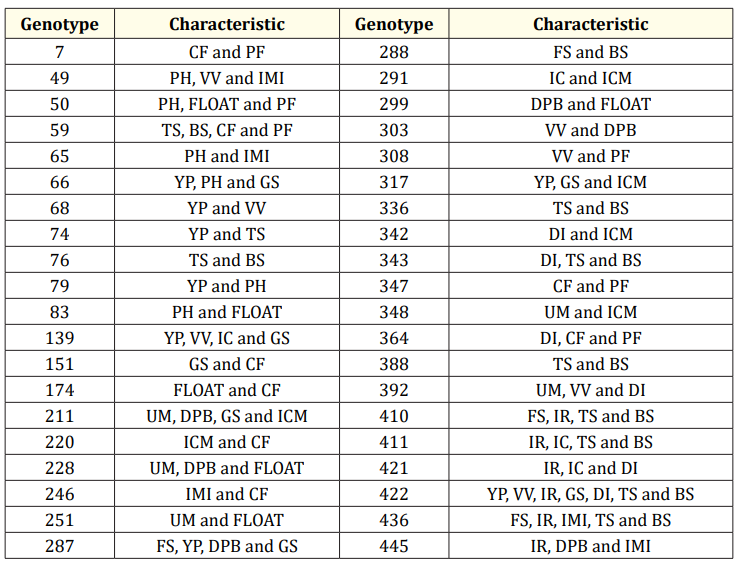
Table 4: Genotypes selected of Coffea canephora as superior for two or more characteristics according to the BLUP method evaluated in the Incaper Active Germplasm Bank during the 2020 and 2021 harvests in Cachoeiro do Itapemirim, Espírito Santo. Fruit size (FS), Uniformity of fruit ripening (UM), Yield per plant (YP), Plant size (PS), Vegetative vigor (VV), Incidence of rust (IR), Incidence of cercospora leaf spot (IC), Drying out of plagiotropic branches (DB), General scale (GS), Incidence of mining insects (IMI), Degree of inclination (DI), Incidence of citrus mealybug (ICR), Percentage of fruit float (Float), Top sieve (TS), Bottom sieve (BS), Yield of ratio field fruits for coconut fruits (CF) and ratio field fruits for pounding grains (PF).
Incaper active germplasm bank has genetic variability to be exploited. Sources of resistance to pests and diseases have been identified, as well as genes responsible for controlling traits of interest such as grain size, size, vigor and high post-harvest yield. This information will be exploited in controlled crosses and gene identification work. The indirect selection process is feasible and recommended due to the high levels of genetic correlation and significance. Characteristics such as general scale, vigor, size and fruit size in the field should be evaluated in breeding programs because they are correlated with other characteristics of interest, many of which have low heritability and therefore lower selection gains. In addition, the correlation analysis shows that sieve analysis in coffee breeding programs should focus on quantifying the proportion of beans with sieve 14 or higher, as this characteristic is inversely proportional and approximately linear to sieve with the proportion of beans with sieve 13 or lower. Genotypes 139, 211, 287, 410, 411, 422 and 436 stand out for their superiority in at least four different characteristics and are therefore strong candidates for the formation of varieties or crosses.
There is no financial interest or any conflict of interest related to the subject matter discussed.
Copyright: © 2024 Viviane Alexia Correia Silva., et al. This is an open-access article distributed under the terms of the Creative Commons Attribution License, which permits unrestricted use, distribution, and reproduction in any medium, provided the original author and source are credited.
 Open Access by
Acta Scientific is licensed under a Creative Commons Attribution 4.0 International License
Open Access by
Acta Scientific is licensed under a Creative Commons Attribution 4.0 International License
Based on a work at https://actascientific.com
ff


