Karim Khaled1*, Vanora Hundley2, Maya Bassil3, Mira Bazzi4, Fotini Tsofliou2,5
1Department of Public Health, Faculty of Health, Education, & Life Sciences, Birmingham City University, Edgbaston, Birmingham, B15 3TN, UK
2Centre for Midwifery & Women’s Health, Faculty of Health & Social Sciences, Bournemouth University, Bournemouth BH8 8AJ, UK
3Department of Human Nutrition, College of Health Sciences, QU Health, Qatar University, Doha, Qatar
4Department of Natural Sciences, Faculty of Arts and Sciences, Lebanese American University, Beirut, Lebanon
5Department of Rehabilitation & Sport Sciences, Faculty of Health & Social Sciences, Bournemouth University, Bournemouth BH8 8AJ, UK
*Corresponding Author: Karim Khaled, Department of Public Health, Faculty of Health, Education, & Life Sciences, Birmingham City University, Edgbaston, Birmingham, UK.
Received: July 01, 2024; Published: August 06, 2024
Citation: Khaled., et al. “The Association between Psychological Stress and Dietary Quality and Patterns among Women of Childbearing Age in Lebanon". Acta Scientific Nutritional Health 8.9 (2024):08-20.
Psychological stress linked to poorer dietary quality can lead to serious diseases. The objective of this study was to examine the association between psychological stress and dietary quality/patterns among childbearing-aged women in Lebanon. Female participants (n = 249) participated in an online survey-questionnaire which included the previously adapted European Prospective into Cancer and Nutrition food frequency questionnaire and stress, depression, anxiety, physical activity, adiposity, and socio-demographic questions. The a-priori dietary quality was assessed through the Mediterranean Diet (MD) index. The a-posteriori latent dietary-patterns (DPs) were derived through factor analysis. Regression analysis was performed to investigate the predictors of the DPs. Participants mainly had a medium MD adherence (61%). No association was found between stress and MD adherence. Factor analysis revealed four DPs: “potatoes, vegetables, legumes, soups and sauces, and non-alcoholic beverages” (DP1), “cereals, fats and oils, milk and dairy products, and sugars and snacks” (DP2), “alcoholic beverages, fish and seafood, eggs, and meats and meat products” (DP3), and “fruits and nuts and seeds” (DP4).
Regression analysis indicated that DP1 was positively associated with monthly income (p = 0.02) and negatively with mother’s educational level (p = 0.03). DP2 was negatively associated with father’s employment status (p = 0.01) and marital status (p = 0.008). DP3 was negatively associated with higher father’s educational level (p = 0.018), but positively with BMI (p < 0.001). DP4 was positively linked with BMI (p = 0.01). Further studies are needed to investigate the association between psychological stress and dietary quality/patterns among Lebanese childbearing aged women.
Keywords: Psychological Stress; Diet Quality; Dietary Patterns; Women; Childbearing Age; Reproductive Age; Childbearing Aged Women; Posteriori
Although the obesity epidemic has reached countries across the globe, in some regions the impact has disproportionately affected women compared to men [1]. Called the Middle Eastern gender health inequality paradox, there is evidence that women in the middle east and north Africa (MENA) region are twice as likely to be obese compared to men [2]. This can be seen in Lebanon, where obesity among women of childbearing age has reached 34% [3]. Over the last two decades, Lebanon has passed through an epidemiologic nutritional transition shifting from the traditional Mediterranean diet to a more western- type of diet [4]. Having unhealthy dietary quality and patterns during childbearing age is one of the main causes of obesity and its related complications during pregnancy (such as gestational diabetes, preeclampsia, caesarian section, macrosomia of the baby) [5].
Following a healthy dietary quality/pattern among women of childbearing age is hence deemed crucial to combat the rise of obesity before and during pregnancy and the preconception stage of women’s life cycle offers an important opportunity for a change in their dietary behaviour [6]. However, the reasons for the gender differences are complex and it is argued that unhealthy diet and lack of physical activity alone cannot account for them [2].
Data demonstrate that around 16.2 to 42.7% of females in Arab countries follow poor dietary quality/patterns (high in saturated fats, sugar, energy-dense foods, and low in fruits, vegetables, and nutrient dense foods) [7]. Factors associated with dietary quality include adiposity, smoking, age, income, education level, race/ethnicity, and marital status [8,9]. There is rising evidence that poor eating habits and poor mental health are highly common among women of childbearing age in the Middle East region [7]. Studies in the MENA region have found that women are more likely to select foods high in calories and fat when experiencing stressful situations [10], but the evidence is conflicting. A recent study conducted in Saudi Arabia found a positive association between psychological stress and the consumption of sweets, cakes, cookies and beverages and a lower consumption of fruits and vegetables among young female students [11]. In Egypt, a study of university students (16-30 years old) found that psychological stress was negatively associated with the consumption of fruits and vegetables among females [12]. In contrast, Ahmad., et al. [13]. found that, among 385 university female students in the United Arab Emirates, stress was positively associated with higher consumption of fruits and vegetables and negatively with sweets and processed meats.
Evidence of the association between psychological stress and dietary quality/patterns in Lebanon is scarce, and studies on psychological stress and diet in the literature have several limitations [14]. For example, dietary intake was assessed through dietary recall questionnaires that did not include all food items and this might have led to under reporting [15-17]. Moreover, the sample sizes of some studies were small, and they did not account for confounding factors such as sociodemographic characteristics and physical activity which were major limitations [12,18,19].
There is a need to understand the factors that influence the high obesity rates among women of childbearing age in Lebanon. No study to date has assessed the association between psychological stress and dietary quality and patterns in Lebanon, particularly among Lebanese women of childbearing age. Looking at the diet-stress relationship in this age group will provide evidence that can inform the development of a lifestyle intervention to improve dietary quality.
This was a cross sectional study designed to investigate the association between psychological stress and dietary quality/patterns among women of childbearing age in Lebanon. An online survey was used to enable a broad range of participants. This was particularly important given the social distancing required by the pandemic.
The target population was women of childbearing age in the Lebanese American University (LAU), Lebanon. A convenience sample of students and staff who were females, aged between 18 and 49 years, and based at the LAU were recruited. Participants were excluded if they had chronic diseases (e.g., cancer, diabetes mellitus, cardiovascular diseases, HIV/AIDS, multiple sclerosis, lung diseases, or mental disorders), suffer from food intolerance/allergy, were pregnant or breastfeeding, were on medications that influence appetite, or had previously had a bariatric surgery. Potential participants were approached via their student emails and classroom visits. Consent was ascertained on the landing page of the survey where participants had the chance to consent prior to answering the survey questions. The online survey included questions on diet, mental health indicators, adiposity measures, and socio-demographic characteristics of participants.
To calculate the sample size, the correlation method was applied based on 80% power, 0.05 significance level, and a correlation coefficient of 0.18 [20]. The correlation coefficient (0.18) was reported in previous studies investigating the correlation between stress and dietary quality/patterns among women of childbearing age in the literature [6,19]. A total sample size of 240 was denoted by the sample size calculation.
The online survey used for collecting data was comprised of the following questionnaires/tools:
The EPIC FFQ is a semi-quantitative dietary tool containing 130 food-items and a set of additional questions that determine further information on the type and brand of breakfast cereal and kind of fat used in frying, roasting, grilling, or baking and the amount of visible fat on meat (Appendix 1). Standard portion sizes are assigned to each of the 130 food-item and respondents were requested to assess the frequency of each one. The food list is associated with a set of nine frequency choices for consumption ranging from ‘never or less than once a month’ to ‘6 or more times per day’. The EPIC FFQ was chosen for dietary assessment because it has been widely used [21] and was recently validated for use among adults in Lebanon [22].
Age, parental education, parental employment status, source of income, current family size, number of persons who sleep in each room of the house, smoking status, parity, and marital status were included in the survey to describe the participants’ sociodemographic characteristics. Adiposity measures (weight, height, and waist circumference) [23] were self-reported. Weight (kg) was divided over height-squared (m2) to derive BMI (kg/m2) [23]. Self-reported weight and height are considered suitable for estimating BMI according to the literature [24].
To assess the impact of behavioural factors on diet, the study explored psychological stress, depression, anxiety, and physical activity. Psychological stress was estimated through the 14-item PSS [25], which was previously validated among Arabs to be used in evaluating stress levels of participants during the past 30 days [26]. Depression was assessed via the 21- item BDI-II that measures the presence and severity of depressive symptoms [27]. The BDI-II has previously shown acceptable validity among Arab population [28]. The anxiety level of participants was assessed using BAI (21-items) which assesses anxiety symptoms over the past week [29]. BAI is considered acceptable for use and has been validated among an Arab population [30,31]. Physical Activity levels were evaluated via IPAQ [32] where participants reported the frequency of undertaking four intensity exercise levels during the past week: vigorous-intensity activity, moderate- intensity activity, walking, and sitting [32]. IPAQ has been previously validated for use among Lebanese adults [33].
PSS was modelled by equally divided quartiles of perceived stress: The first quartile represented participants with the lowest level of stress (score of 0-14), second quartile contain ones with middle-lowest level of stress (score of 14-28), third quartile with middle-highest level of stress (score of 28-42), and fourth quartile representing ones with highest level of stress (score of 42-56) [34,35]. Depression scores were derived from the 21-item BDI-II by scoring each question from zero to three and then summing the total scores of the 21 items to get a total score between 0 and 63 [27]. Depression was considered minimal when the total BDI-II score was between 0 and 13, mild when score was between 14 and 19, moderate when score was between 20 and 28, and severe when score was between 29 and 63 [27]. The level of anxiety was determined from BAI score as follows: low anxiety level (0-21), moderate anxiety level (22-35), potentially concerning anxiety level (≥36) [29]. From the adapted EPIC food frequency questionnaire, 15 food groups (gams per day) were derived: fruits, vegetables, cereals, nuts and seeds, legumes, potatoes, fish and sea food, meat and meat products, milk and milk products, alcoholic beverages, non-alcoholic beverages, eggs, sugars and snacks, fats and oils, and sauces and soups. The a-priori dietary quality was assessed through the Mediterranean Diet Index which measures the adherence to Mediterranean Diet (MD) based on nine food groups (grams per day): fruits and nuts, vegetables, legumes, cereals, fish and seafood, alcoholic beverages, meat and meat products, milk and dairy products, and the ratio of unsaturated to saturated fats [36]. Participants whose consumption was below the intake of fruits and nuts, vegetables, legumes, cereals, fish and seafood, and the ratio of unsaturated to saturated fats were given a score of 0 whereas those whose consumption was at or above the media were given a score of 1. In contrast, participants who consumed below the median intake of meat and meat products and milk and dairy products were given a score of 1 and those whose consumption was at or above the median intake of these food were given a score of 0. For alcoholic beverages, participants who consumed between 5 and 25 grams per day were given a score of 1 and those whose consumption was outside that range were given a score of 0 [36]. Additionally, a-posteriori dietary patterns were identified through factor analysis. Assuming that there are underlying (latent) dietary patterns among our target population, factor analysis was performed to uncover these latent patterns. The 15 food groups (grams per day) were included in the factor analysis and statistical transformations were applied to correct for non-normally distributed data and high skewness. The appropriateness of factor analysis was determined through Kaiser Meyer Olkin (KMO) and Bartlett’s test of sphericity, and the results indicated a large KMO of 0.8 (> 0.5) and a very significant Bartlett’s test of sphericity (p < 0.0001). Therefore, factor analysis was deemed appropriate for data analysis. A scree plot was created to select the number of dietary patterns (factors) retained. Based on the hypothesis that the factors were uncorrelated, a varimax rotation was used to compute the factor loading for each food group across the factors (dietary patterns) revealed. Further, simple linear regression was run for each factor (dietary pattern) to investigate the association between each dietary pattern and the variables in the data (such as stress, anxiety, BMI, etc.) After that, variables that had a significant association were included in a multiple regression model along with all other variables that showed significant association with the specific dietary pattern.
Statistical analysis was done using IBM SPSS statistics version 28 (Chicago, IL, USA). Shapiro-Wilk tests were performed to assess the normality of the data. Normally distributed data are presented as means and standard deviations and non-normally distributed data are presented as medians and interquartile ranges. Variables were compared across the three MD adherence categories through Chi-square tests for categorical data and Kruskal Wallis tests for continuous data
In total, 249 participants were included in the analysis after excluding 6 participants for having incomplete data and not meeting the inclusion criteria on the landing page of the study survey. The majority (61%) of the participants had a medium adherence to Mediterranean Diet (MD) (Figure 1).
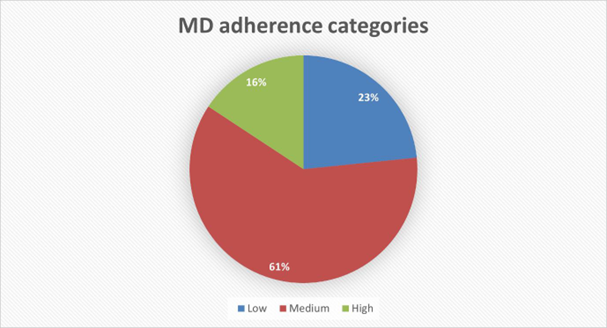
Figure 1: Pie chart showing the percentage of participants with low, medium, and high adherence to Mediterranean Diet.
Table 1 shows the socio-demographic characteristics of participants who were mainly single (96.4%), non-smokers (73.5%), and never gave birth (94.8%). Additionally, around 42% of participants had a monthly income of less than 500$ and family support was the source of income for 80% of them. The percentage of participants with family sizes of ≤ 4 and ≥ 5 persons were 45.8% and 53%, respectively, and 79.1% of them reported to have < 2 persons in each room of their house. Regarding their parental status, the majority of participants parents (father and mother) were university graduates and work as employees. Chi-square tests performed for all socio-demographic variables showed no significant difference between any variable across the three MD adherence categories.
Table 1: Socio-demographic characteristics of participants (n = 249). P-values are derived from Chi-square tests for categorical variables. Q1: Quartile 1 (Low MD adherence), Q2: Quartile 2 (Medium MD adherence), Q3: Quartile 3 (High MD adherence).
The mean (standard deviation) and median (interquartile range) of the physical and mental characteristics of the study sample are presented in table 2. The Kruskal-Wallis H non- parametric tests for stress score, depression score, anxiety score, BMI, and physical activity showed no significant difference between these variables across the categories of adherence to MD. Age was found to be statistically different among the MD adherence categories (X2(2, n = 249) = 10.376, p = 0.006). Participants with an age of more than or equal 20 years were less likely to have high MD adherence (28.9%) than those who aged ≤19 years (71.1%). After adjusting values by the Bonferroni correction for multiple tests, pairwise comparisons showed that age was different between low and medium MD adherence categories (p = 0.02), but not between low and high (p = 0.97) nor between medium and high MD adherence categories (p = 0.75).
The scree plot in figure 2 indicates that the number of factors (dietary patterns) with an eigenvalue ≥ 1 retained from factor analysis is four.
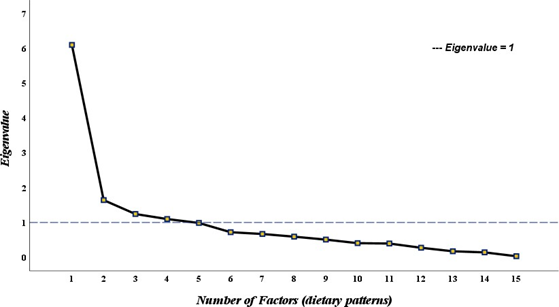
Figure 2: Scree Plot of the 15 food groups (grams/day) showing the Eigenvalues and the number of factors (dietary patterns).
Table 2: Physical and mental characteristics of participants (n = 249). *Median (Interquartile Range), ^ Mean (Standard Deviation). Q1: Quartile 1 (Low MD adherence), Q2: Quartile 2 (Medium MD adherence), Q3: Quartile 3 (High MD adherence). MDS: Mediterranean Diet Score. METs-hr/wk: Metabolic Equivalents of tasks-hours per week. P-values for continuous variables are derived from Kruskal-Wallis H non-parametric tests. P-values for categorical variables are derived from Chi-square tests.
The four factors (dietary patterns) that were retained from factor analysis explained 67% of the total variance in data (Table 3). The varimax rotation used in the analysis to compute the factor loadings of the food groups is presented in table 3 and shows that four food groups (grams per day) were found in factors 1,2, and 3 (DP1, DP2, and DP3) while two food groups were found in factor 4 (DP4). The first dietary pattern (DP1) had high factor loadings for potatoes, vegetables, legumes, soups and sauces, and non-alcoholic beverages. The second dietary pattern retained (DP2) contained cereals, fats and oils, milk and dairy products, and sugars and snacks. Dietary pattern 3 (DP3) included alcoholic beverages, fish and seafood, eggs, and meats and meat products. The fourth dietary pattern (DP4) included fruits and nuts and seeds food groups.
Table 3: Varimax-rotated factor loadings for the four factors (dietary patterns) of the 15 food groups derived from the adapted EPIC food frequency questionnaire. DP: Dietary Pattern.
Table 4 shows the multiple regression models of the four dietary patterns retained from factor analysis. The first model of DP1 was based on the following equation: DP1 = β0 + β1Age + β2Mother’s educational level + β3Monthly income. Results showed that DP1 was negatively associated with higher educational level of the mother (university graduate) (p = 0.03).
Additionally, the first regression model showed a positive association with monthly income (p = 0.02). DP1 was found to be dominant among childbearing aged women who had a higher income and a lower mother’s educational level.
Model 2 was formed on the subsequent formula: DP2 = β0 + β1Father’s employment status + β2Marital status. Table 4 shows that the second regression model indicates that DP2 had a negative association with Father’s employment status (employee) (p = 0.01) and marital status (single) (p = 0.008). DP2 was found to be uncommon among the single women whose father work as an employee.
The third multiple regression model was formed based on the formula: DP3 = β0 + β1BMI + β2 Father’s educational level. Model 3 showed that DP3 was positively associated with BMI (p < 0.001) and negatively with higher father’s educational level (university graduate) (p = 0.018) (Table 4). This pattern was common among women with higher BMI but lower father’s educational level.
Model 4 was formed on the subsequent formula: DP4 = β0 + β1Depression+ β2BMI. The fourth regression model indicates that DP2 had a positive association with BMI (p = 0.015) (Table 4). DP4 was found to be common among women who have greater BMI (kg/m2).
Table 4: Multiple regression models presenting the association between the dietary patterns derived from factor analysis and the variables in data.
This is the first study in Lebanon to examine the link between perceived stress and dietary quality/patterns in women of childbearing age. The relationship between stress and dietary quality/patterns has recently attracted the attention of health researchers, particularly because diet is a major modifiable risk factor for obesity and a variety of chronic diseases [15]. In the present study, dietary quality/patterns analysis was applied instead of individual- nutrient assessment since it allows the exploration of the entire population's diet and is deemed vital in evaluating the association between dietary intake and diet-related diseases [37]. Furthermore, it is difficult to examine the association between stress and single nutrients because they are never taken separately but more as part of a meal, and they metabolically engage with one another [37].
The a priori evaluation of dietary quality revealed a medium adherence to the Mediterranean Diet (~61% of the total sample) with only ~15% of the sample having high adherence and 24% having low adherence. This suggests that women in Lebanon are indeed shifting from the traditional Mediterranean Diet to a more western-type diet. Similar findings were found in the United States, where the majority of the of childbearing age women (18-44 years old) sample (43%) had a medium adherence to the Mediterranean Diet [38], and in the United Kingdom, where most females in the workplace (n = 426) had a medium adherence to the Mediterranean Diet Index (n = 346) [39]. Likewise, our research team investigated dietary quality using the Mediterranean Diet Index across 123 women of childbearing age in the UK and found medium adherence [40]. The Mediterranean Diet has been recognized as offering numerous health benefits [41] and therefore to ensure good diet quality, it is important that nutrition counseling and education are considered as part of a holistic approach to reproductive health care. Ideally this should be enhanced and provided to women of childbearing age with the aim of improving their dietary quality prior to pregnancy.
The a-posteriori dietary analysis (Table 4) provided clearer dietary insight by revealing the food groups that contribute to the dietary patterns of the Lebanese sample of women of childbearing age. In the current study, four dietary patterns (DPs) were identified: “potatoes, vegetables, legumes, soups and sauces, and non-alcoholic beverages” (DP1), “cereals, fats and oils, milk and dairy products, and sugars and snacks” (DP2), “alcoholic beverages, fish and seafood, eggs, and meats and meat products” (DP3), and “fruits and nuts and seeds” (DP4). Psychological stress was not associated with any of the four DPs, which contrasts with what other studies have found [14,37]. For instance, our previous study among women of childbearing age in the UK found that psychological stress was significantly associated with the “fats and oils, sugar and snacks, alcoholic beverages, red/processed meat, and cereals” DP (p = 0.005) and negatively with the “fruits, vegetables, nuts and seeds” DP (p < 0.001) [14]. Additionally, El-Ansari., et al. [37] measured psychological stress through the Perceived Stress Scale and dietary intake through a 12-food item FFQ and reported a significant association between psychological stress and high intake of fat, sugar and snacks, and low intake of fruits, and vegetables among female students in the UK.
The a-priori and a-posteriori dietary approaches of this study showed that there appears to be no relationship between psychological stress and the dietary quality/patterns among the Lebanese sample of childbearing aged women who took part in this study. These findings are consistent with other studies that have investigated the link between stress and diet. However, the evidence is contradictory and appears to reflect a geographical variation as figure 3 shows.
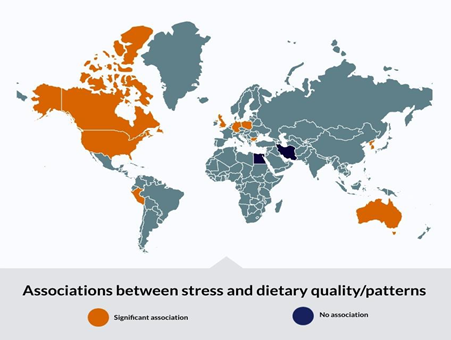
Figure 3: World map showing the countries with significant associations (in red orange) versus countries with no significant association (in dark navy blue) between psychological stress and dietary quality/patterns.
As Figure 3 shows, there are countries with significant associations (in red orange) between stress and dietary quality/patterns and countries where there was no significant association (in dark navy blue). This figure was built based on a previous systematic review and meta-analysis that included 24 studies on the association between stress and dietary quality and patterns (food intake and frequency of consumption) [6]. Most studies that found a significant association between stress and diet were from the western countries (e.g., UK, USA, Germany, Poland) whereas most studies that found no association were from the Middle East.
Richardson., et al. [19]. measured psychological stress using the 14-item PSS and dietary quality using the Healthy Eating Index-2010 among a hundred and one childbearing aged women (aged 18–44 years) and found null association. Similarly, Ferranti., et al. [42] found no link between stress and dietary quality among 433 female university and health center employees in the United States. In that study, the Alternate Healthy Eating Index, Mediterranean Diet Index, and Dietary Approach to Stop Hypertension Index were used to assess a-priori dietary quality and the 14-item PSS to assess stress levels of participants. Two further studies among women of childbearing age in Egypt (12) and Iran (43) showed no significant association between dietary quality and psychological stress.
On the other hand, several studies have found a significant association between psychological stress and dietary quality/patterns. For instance, El-Ansari., et al. [37] assessed stress levels using the Perceived Stress Scale and nutritional habits using a 12-food item FFQ and discovered that stress was associated with impaired dietary quality, as evidenced by high intake of sugar, snacks, fat, and low intake of unsaturated fats, fruits, and vegetables among British female university students. Furthermore, Isasi., et al. [44] discovered that psychological stress was negatively related to dietary quality (Alternate-Healthy Eating Index 2010) among Hispanic/Latina females in the United States. Similarly, Groesz., et al. [45] recruited 561 females in the United States and found that highly stressed women had a greater consumption of unhealthy foods (fast food, sweets, etc.) and little consumption of whole grains, fruits, and vegetables. Another study provided a positive correlation between stress and bad food habits [46] among females across three countries (Germany, Poland, and Bulgaria). Additionally, a cross-sectional study among 244 women of childbearing age in the UK has found a negative association between psychological stress and adherence to the Alternate Mediterranean Diet Index (a-priori dietary approach). The study also reported significant associations between psychological stress and the a-posteriori derived dietary patterns where stress was associated with the intake of a dietary pattern was comprised of “fats and oils, processed meats, sugars and snacks, alcohol, and cereals” food groups (p = 0.005) and negatively with a dietary pattern including “fruits, nuts, vegetables, and seeds” food groups (p < 0.001) [14]. Habhab., et al. [47] examined the relationship between stress, food restraint, and dietary quality/patterns among 40 women of childbearing age, finding that women with poorer dietary quality had a higher psychological stress level. The findings of a systematic review and meta-analysis [6], that investigated the association between psychological stress and dietary quality in childbearing aged women, were also contradicting those of the present study. The systematic literature review included 24 studies (8 with dietary quality as the primary outcome and 16 with food frequency of intake as the primary outcome) with a total of 41,033 individuals.
Overall, the 16 studies on food intake and frequency of consumption (n = 33,477) reported that psychological stress was linked to a higher intake of fat, fast food, sweets, processed foods, and a low intake of fruits, vegetables, whole grains, and legumes, as well as a low intake of fruits, vegetables, whole grains, and legumes. The meta-analysis comprised 8 studies (n = 7556) on dietary quality and found a significant negative relationship between stress and dietary quality (r = 0.35, p 0.001, 95% CI (0.56;0.15). Variations in sample sizes, diversity of the instruments used to assess variables, and differences in the population from which the sample was taken could explain discrepancies in findings between prior studies and the current study. In other words, these differences within the methodologies of different studies might affect the accuracy of data and the extent of reporting-error of each tool used to collect data. For instance, most studies on the relationship between psychological stress and dietary quality in women of childbearing age have used 24-hour recalls as the dietary assessment tool [15-17,19,44], whereas the adapted EPIC food frequency questionnaire was used in the current study, which measures a wide range of food items and their frequency of consumption over the previous year.
Reflecting on the contradictory nature of the evidence, one might ask whether geographical, sociodemographic-related, or cultural factors pertaining to western or middle eastern countries can derive a diverse association between stress and diet. As previously mentioned, most countries, where a significant association between stress and dietary quality and patterns was observed, were western countries (Figure 3) and countries with no significant association were more in the middle east (Lebanon, Egypt, Iran). One reason might be that, unlike the western countries, in the middle east and especially Lebanon, which is a Mediterranean country, the traditional type of diet is a Mediterranean style diet, and this is shown in our results where most of our sample (61%) had a medium adherence to MD. Additionally, a study by Jomaa 2016 has found that the Lebanese dietary pattern is highly correlated with several dietary quality indices (the Alternative Health Eating Index (AHEI), the alternate Mediterranean diet score (aMED), the Dietary Diversity Score (DDS), the Dietary Approaches to Stop Hypertension (DASH)-style diet score, and the Lebanese Mediterranean Diet index (LMD)) indicating that the Lebanese dietary pattern is of high dietary quality. So, upon stress, women in Lebanon tend to still maintain some level of adherence to the Mediterranean diet (even if with an increased unhealthy foods). Further research is needed to explore the underlying factors that could explain these differences.
To better understand the stress/diet relationship, studies have suggested that there is a bidirectional relationship between psychological stress and dietary quality/patterns [37]. For instance, high levels of psychological stress were linked to weight dissatisfaction and other health-risking behaviors such alcohol consumption, binge eating, smoking, and missing breakfast in a group of female students [48]. To alleviate their unpleasant emotions, stressed people tend to consume high energy-dense foods [49]. The lack of eating control, according to Adam., et al. [49], is a major factor in these eating behaviors coming from unpleasant emotions and stress. When the ingestion of high-calorie, appealing meals is linked to satisfaction and reward, it is referred to as comfort eating during stressful times [49]. However, some researchers have found no substantial link between perceived stress and dietary quality/patterns, contradicting these claims. This can be explained by the following non-food coping methods, such as spirituality, which have been shown to reduce the impact of psychological stress on eating behavior [50]. Although there are no significant links between psychological stress and dietary quality/patterns in all these study results, other factors such as stress coping strategies, cultural food traditions, cognitive factors (such as nutrition knowledge), and food cost, may influence dietary patterns and quality and should be further examined [51].
This is the first study to investigate the association between psychological stress and dietary quality and patterns among Lebanese women of childbearing age. Dietary quality/patterns were analyzed comprehensively using two methods: a-priori (hypothesis- driven) and a-posteriori (data-driven), both of which provided reliable results and a clearer overview of the study's participants' overall dietary quality/patterns. The methods adopted to assess the variables were standardized and validated, such as the Perceived Stress Scale to assess stress levels [25] and Becks Depression Inventory II to assess depression [27], in addition to the anthropometric and socioeconomic questions [52-54], are another strength of this study. In contrast to most previous research on the association between psychological stress and diet that used diet recalls estimating dietary intake, this study used the adapted EPIC food frequency questionnaire [22], which is widely regarded as the gold standard dietary assessment tool [21,55].
On the other side, there are a few limitations that should be acknowledged. Because of the study's cross-sectional methodology, it was difficult to draw and generalise a definitive conclusion about the relationship between psychological stress and dietary quality/patterns among childbearing aged women. Furthermore, the convenience sample was drawn from a population of women of childbearing age in a Lebanese university context, and hence may not be representative of the general population of women of childbearing age in Lebanon. Even though all variables were measured using validated and standardised tools, the response of participants was self-reported, which could have resulted in inaccuracy of the results.
Advanced and more precise tools such as Dual-Energy X-ray Absorptiometry (DEXA), which asses the whole-body composition including weight, height, fat mass, and fat-free body mass, would be better in estimating the anthropometric measures of participants [56]. Likewise, the Perceived Stress Scale, which was used to assess participants' psychological stress levels, was self-reported, thus participants may not have accurately recalled stressful occurrences from the previous weeks. In future investigations, a more accurate measure of stress, such as salivary cortisol, should be used [57]. Moreover, food intake biomarkers (such as urine and blood samples) that objectively evaluate an individual's nutritional intake should be used to supplement meal frequency questionnaires and other self-reported dietary intake indicators [58].
In the current study, no association was found between stress and diet quality and patterns among a Lebanese sample of childbearing aged women. Recent studies suggest that psychological stress might lead to poorer diet and/or no change in diet depending on several factors such as population, tools used, stress coping strategies, cultural food traditions, and cognitive factors. Further randomised controlled trials with accurate tools are needed to confirm these results and should further aim to identify the underlying factors that could explain the association between psychological stress and dietary quality/patterns among childbearing aged women in Lebanon.
As authors, who have used the FETA software for the analysis of the EPIC FFQ data in the present study, we are asked by FETA-software team to acknowledge the following: The EPIC-Norfolk study (DOI 10.22025/2019.110.1105.00004) has received funding from the Medical Research Council (MR/N003284/1 and MC-UU_112015/1) and Cancer Research UK (C864/A14136). We are grateful to all the participants who have been part of the project and to the many members of the study teams at the University of Cambridge who have enabled this research. The authors also acknowledge that figure 3 was designed through Visme website (www.visme.co).
This research received no specific grant from any funding agency, commercial or not-for-profit sectors.
None
[Conceptualisation and study design, K.K., F.T., and V.H.; methodology, K.K., F.T., V.H., M.B.1, and M.B.2; ethical approval applications preparation: K.K., F.T., V.H., M.B.1, and M.B.2; data collection, K.K., M.B.1, M.B.2; formal data analysis, K.K.; data interpretation, K.K., F.T., and V.H.; writing—original first draft preparation, K.K.; writing- review and editing, K.K., F.T., and V.H.; supervision, F.T. and V.H. All authors have read and agreed to the published version of the manuscript.]
This study was conducted according to the guidelines laid down in the Declaration of Helsinki and all procedures involving research study participants were approved by the [Lebanese American University Institutional Review Board] IRB#: LAU.SAS.MB3.27/Nov/2020. Written informed consent was obtained from all subjects/patients.
Copyright: © 2024 Khaled., et al. et al. This is an open-access article distributed under the terms of the Creative Commons Attribution License, which permits unrestricted use, distribution, and reproduction in any medium, provided the original author and source are credited.
 Open Access by
Acta Scientific is licensed under a Creative Commons Attribution 4.0 International License
Open Access by
Acta Scientific is licensed under a Creative Commons Attribution 4.0 International License
Based on a work at https://actascientific.com
ff


