Manoj Kumar T1*, Anuradha K2 and Sucharitha KV3
1 Research Scholar, Department of Home Science, SV University, Tirupati, India
2Professor, Department of Home Science, SV University, Tirupati, India
3Professor, Food Science Nutrition and Dietetics, Department of Home Science, SV University, Tirupati, India
*Corresponding Author: Manoj Kumar T, Research Scholar, Department of Home Science, SV University, Tirupati, India.
Received: June 24, 2017; Published: August 05, 2024
Citation: Manoj Kumar T., et al. “Assessment of Anthropometry Measurements of Pre School-Children According to Age and Gender in Tirupati, Andhra Pradesh". Acta Scientific Paediatrics 8.9 (2024):03-07.
Pre-schoolers start to show independent nature and are generally fussy eaters. Pre - school age which coincides with to 2-6 years is vulnerable because of rapid growth rate, during this stage. Young children need more attention and care for the physical and psychological development. Physical growth, development and well-being are directly related to the nutritional status. Anthropometric indicators can be used as a screening device to identify children at risk of under-nutrition or over-nutrition, followed by a more elaborate investigation using other techniques. The Literature found relationship between the age, gender and anthropometry profile of children. The present study was conducted to understand the relationship among demographic data like age, gender and anthropometric indices of pre - school children. The study sample were 321 pre-school children (Boys-178 and Girls-143), attending Anganwadis in Tirupati urban of Andhra Pradesh State. The Results revealed that when compared with WHO standards. All the ages from 2-6 years the boys and girls height was less than the standards. As per the ‘Z’ scores 25 to 30 percent of boys and girls were below normal. The data alarms the need of alteration to collection the deprived growth in pre-school children. Good nutrition is still possible to achieve the deprived growth, to which the mothers have patience and follow indigenous traditional foods.
Keywords: Age; Gender; Anthropometry; Nutritional status; Pre-School Children
Children are most important as they are the future citizens. Providing an optimal physical, social, psychological and emotional development is important for a healthy nation. A child’s future health depends on proper nutrition during early year of life [1]. Studies have shown that under nourishment, child stunting, child wasting, and child mortality reflect deficiencies in calories as well as in important micronutrients. India is home to the largest number of underweight and stunted children in the world [2]. Malnutrition is the leading cause of morbidity and mortality among children under the age of five in the world. It has been reported that malnutrition is characterized by a several of problems like stunted growth, weight loss, low intelligence, weak resistance to infection and poor social development and in extreme cases undesirable malnutrition can lead to death [3,4]. According Global Hunger Index (2023), India is experiencing a severe micronutrient deficiency. According GHI (2023), India’s position is 111th out of 125 countries. Whereas, neighbouring Pakistan fall under 102th, Bangladesh 81th, Nepal 69th and Sri Lanka 60th rank faring better than India in the index. When GHI 2023 is compared against GHI 2022, India slipped four notches from its 107th position [5]. Global Hunger Index, 2023 reported literature showed that nutritional problems among children cause major morbidity and mortality in India. There are several causes of this problem, including poor diet, disease, and a failure to meet micronutrient needs during pregnancy and lactation.
The corona pandemic has left a severe impact on nutritional status of people all over the world including young children. To assess the nutritional status of children below 6 years of age, the present study was conducted with the following objectives:
The Sample of the study were pre-school children studying in Government Schools (Anganwadi) of Tirupati urban of Andhra Pradesh State. With the approval from the Child Development Project Officer (CDPO), Tirupati Urban, three hundred and twenty one children (321), (Boys - 178 and Girls - 143) in the age group of 2-6 years were identified using systematic stratified random sampling technique from fifteen Anganwadis in Tirupati. The sample children’s height and weight were measured using standard procedures for measurements. Weight was measured to nearest 100 gms using digital scale. Height was measured to nearest 1 mm using a non-stretchable tape.
The data was collected, pooled, tabulated and presented in the following tables:

Table 1: Distribution of Sample According to the Gender and Age.
From table 1 it is clear that the sample constituted 55.45 percent of boys and 44.55 percent of girls. Among 321 sample, nearly one third (32.08 percent) were in the age group of 3-3.11 months, around one fourth (23.67 and 24.29 percent) of sample children were in the age ranges of 2 -2.11 months and 4-4.11 months. 15.57 percent were in the age group of 5-5.11 months and very few (4.39 Percent) were in the age group of above 5.11 months.

Table 2: Mean Height of Sample Anganwadi Boys According to the Age and WHO Standards.
It divulges from table 2 that when compared with the WHO standards, Sample boys belonging to all age groups except that of 3 to 3.11 months were found to be below to standards of WHO. Whereas, children belonged to 3 to 3.11 months recorded mean height of 96.1 ± 9.81 which is in the range of WHO standards (96.1-102.8). Thus, the present data shows that majority of boys had stunted growth. In a study conducted at Mysore, Lokesha., et al, (2017), also reported that according to height for age, 46% of preschool children were having normal height and 54% of preschool children were mildly and moderately impaired [6].

Table 3: Mean Height of Sample Anganwadi Girls According to the Age and WHO Standards.
It divulges from table-3 that when compared with WHO standards, sample girls belonged to all age group accept that of 2 to 2.11 months were found to be below the standards of WHO. Whereas, sample girls belonged to 2 to 2.11 months recorded mean height of 88.4 ± 9.88 which is in the range of WHO standards (86.4-94.4). Along with sample boys, sample girls also had stunted. The mean standard deviation is 9.88% which says ±, hence more than 88.4% of girls are also less height to standards.
Weight of pre-school children is also an important indicator to assess the nutritional status of children.

Table 4: Mean Weight of Sample Anganwadi Boys According to the Age and WHO Standards.
It is known from table 4 that when compared with WHO standards sample boys belonged to 2 to 2.11 months and 4 to 4.11 months were found to be above the standards of WHO. Whereas, children belonged to 3 to 3.11 and those who were above 5 years of age had mean weight below the WHO standards. The sample were from Anganwadi schools and majority belonged to lower middle and low income groups.
In a study conducted at Sri Lanka, Galgamuwa., et al., (2017) reported that overall high number of preschool children (35.6%) were observed with underweight, stunting (26.9%) and wasting (32.9%) and it was reported that undernutrition was more among boys than girls. The author expressed that the reason may be low standard of living, high lack of infectious diseases and low purchasing ability, all of which have an effect on practices of children [7].

Table 5: Mean Weight of Sample Anganwadi Girls According to the Age and WHO Standards.
It divulges from table 5 that when compared with the WHO standards, sample girls belonged to all age groups 3 to 3.11, 4 to 4.11 and above 5 years were found to be below standards of WHO. Whereas, children belonged to 2 to 2.11 months recorded mean weight of 14.4 ± 7.88, which was more than WHO standards. The mean weight data of sample boys and girls showed that children were up to the standards and above the standards up to 2 to 2.11 years. As the age progressed the weight of sample children were below the standards. The reason may be that by the time 3 years, children attend pre-school and food preference of children start and involve in play for more time.
The anthropometry data was converted into z sores based on the WHO Standards (2014).

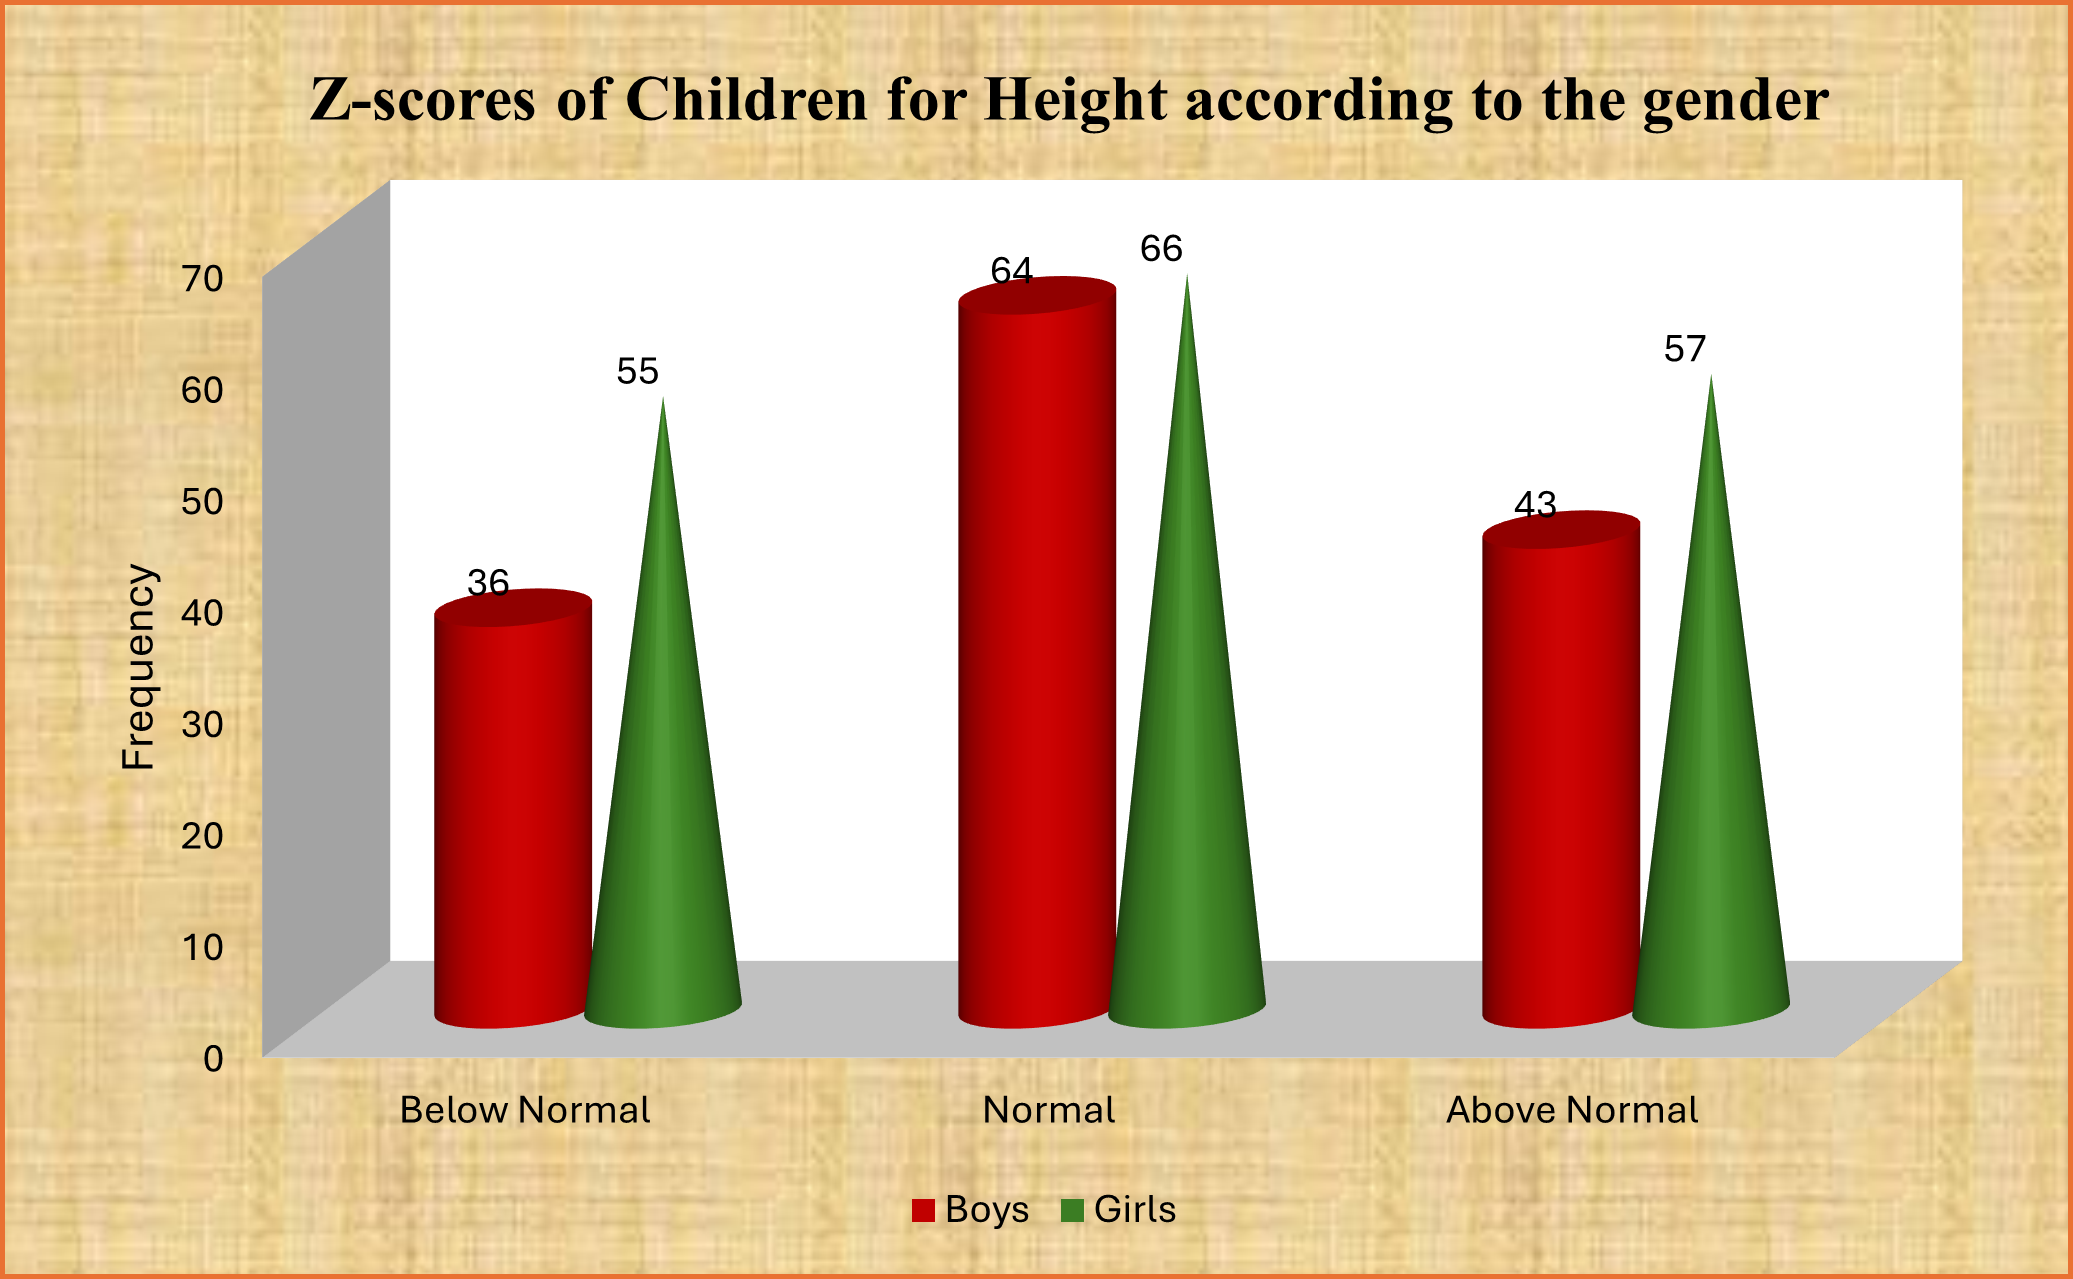
Figure a

Table 6: Z-score of Children for Height According to the Gender.
Gender wise Distribution of Z-Scores according to height across different categories of malnutrition shows that 44.75 percent of sample boys and 37.07 percent of sample girls were in the normal categories of nutritional status. Next to it, 30.08 percent of boys and 32.04 percent of girls were in the categories of above normal nutritional status. One fourth of boys (25.17percent) and 30.89 percent of girls were in below normal category. As nearly one third of sample girls and fourth of sample boys recorded below normal status there is a need to explore the reasons for malnourishment among children.

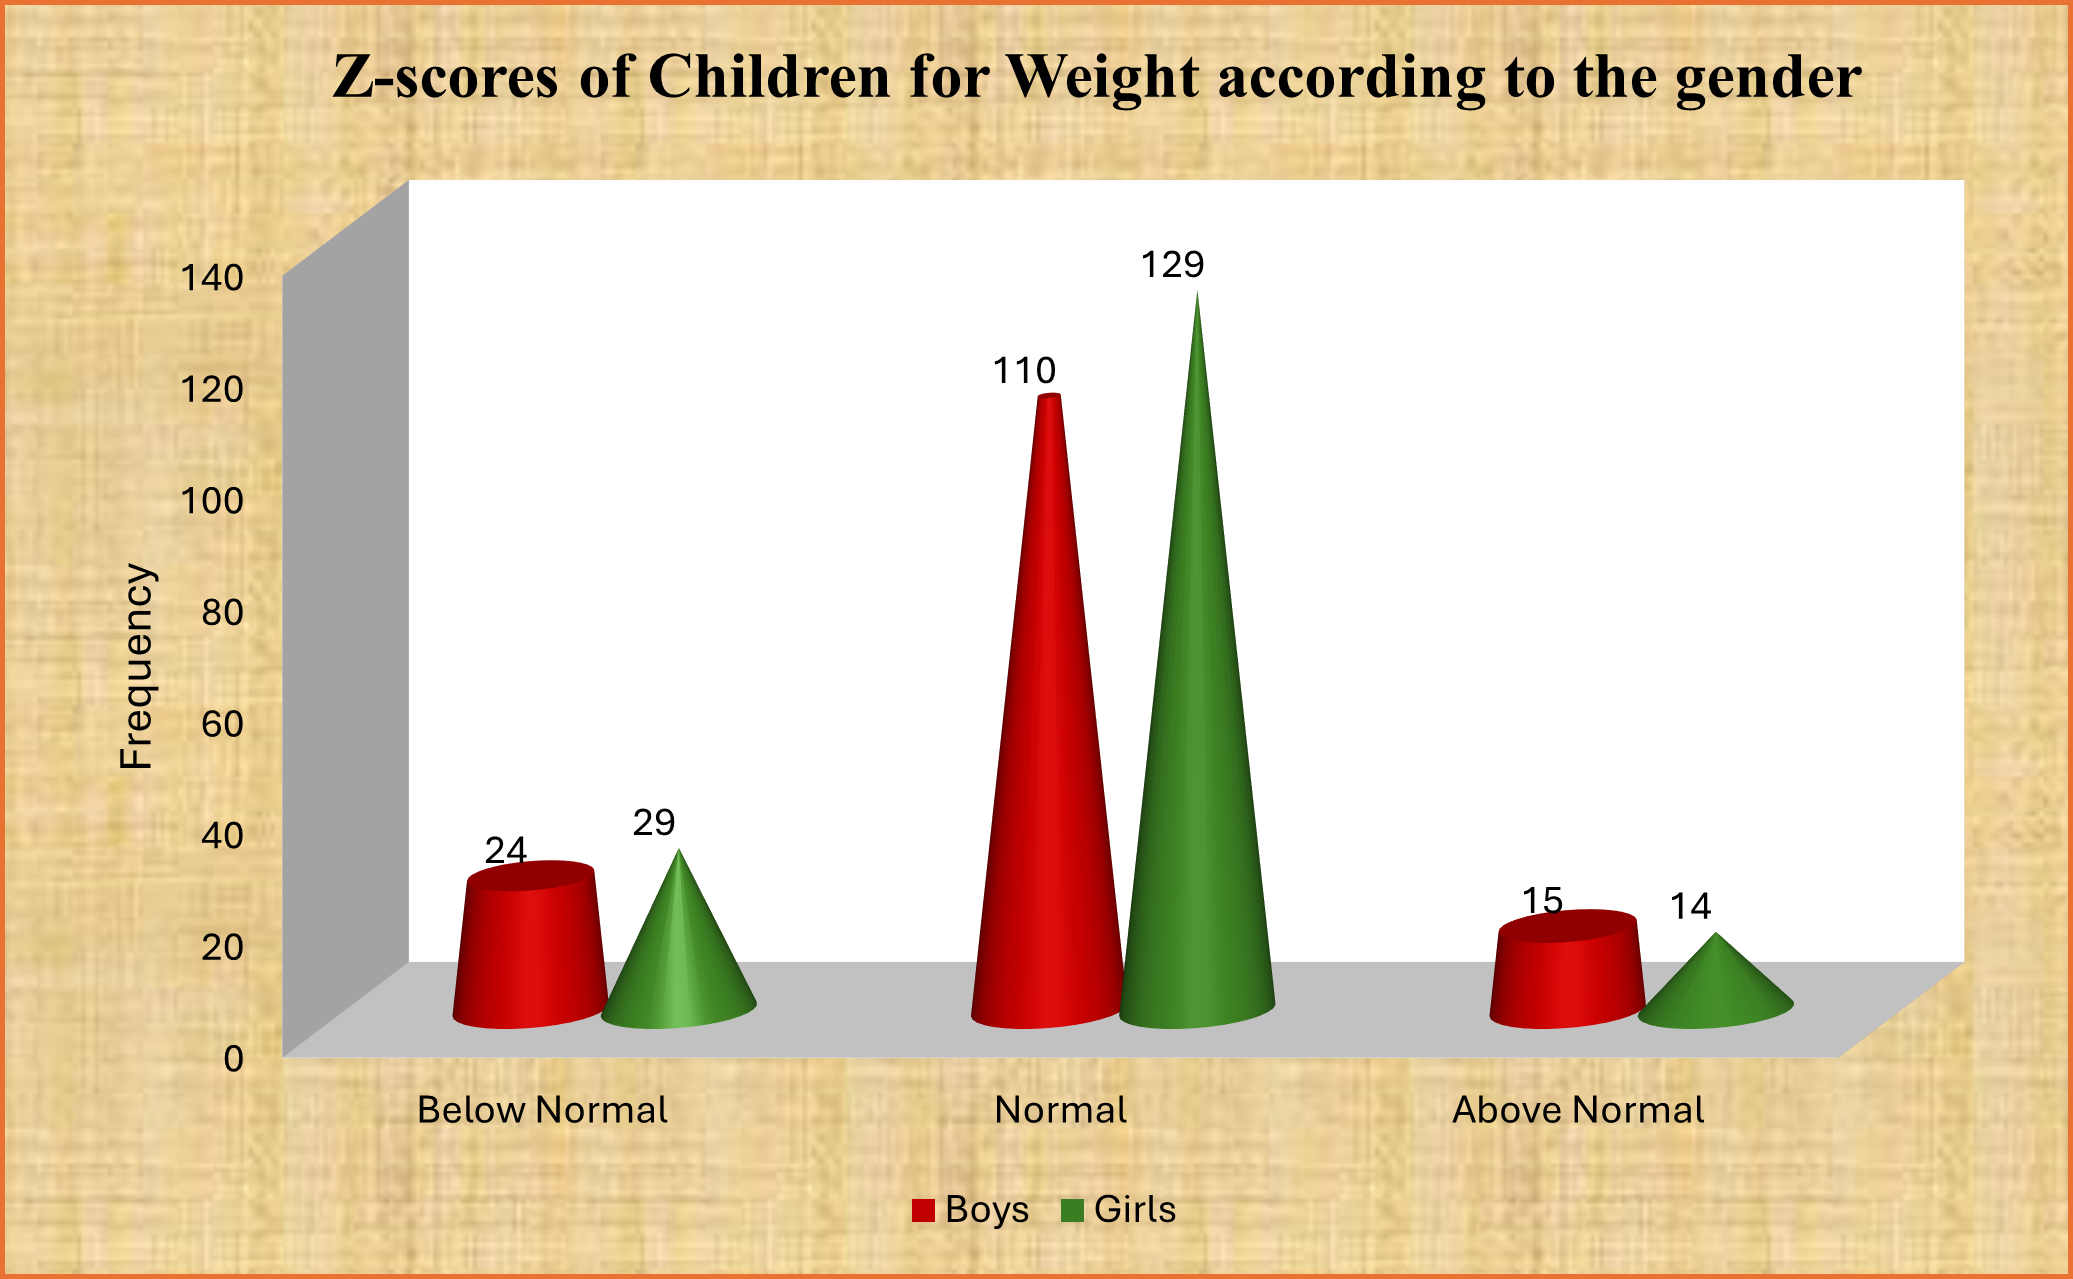
Table 7: Z-score of Children for Weight According to the Gender

Figure b
Gender wise distribution of Z-Scores according to weight across different categories of malnutrition shows that 73.82 percent of boys and 75.0 percent of girls were in the normal category of nutritional status. Next to it, 16.10 percent of boys and 16.86 percent of girls were in the category of above normal nutritional status. Only few percent of boys (10.8 percent) and 8.74 percent of girls were in below normal category, which shows good nutritional status among sample children as per their weights.
From the above discussion following conclusions can be drawn.
This is a need for advice to intervene to improve children’s nutritional status by targeting in the below following ways
Copyright: © 2024 Manoj Kumar T., et al. This is an open-access article distributed under the terms of the Creative Commons Attribution License, which permits unrestricted use, distribution, and reproduction in any medium, provided the original author and source are credited.