Kulvinder Kochar Kaur*
Department of Obstetrics and Gynaecology, Specialist Reproductive Endocrinology and Infertility Specialist, Scientific Director Cum Owner Dr Kulvinder Kaur Centre for Human Reproduction, Punjab, India
*Corresponding Author: Kulvinder Kochar Kaur, Department of Obstetrics and Gynaecology, Specialist Reproductive Endocrinology and Infertility Specialist, Scientific Director Cum Owner Dr Kulvinder Kaur Centre for Human Reproduction, Punjab, India.
Received: September 25, 2024; Published: October 07, 2024
Citation: Kulvinder Kochar Kaur. “Exposition of Lost Function of Exhausted CD8+ T Cells in Chronic Hepatitis B Virus (HBV)/cHCV Infections: Enolase as Ametabolic Checkpoint for Variable Exhaustion Programmes in Hepatitis Virus- Particular CD8+ T Cells- A Short Communication". Acta Scientific Gastrointestinal Disorders 7.11 (2024):15-24.
Earlier it was shown that exhausted CD8+ T cells accrual in patients with chronic hepatitis B virus (HBV) and cHCV infections, aided in nonexistent clearance of viral infections. Such exhausted CD8+ T cells have incapability of adequate antiviral working. Nevertheless, as the exact mechanistic modes estimating such exhausted T cell programmes were uncharted, recently asssessment of exhaustion, metabolic profiles, transcriptome of virus particular CD8+ T cells in chronic HBV (n = 31) and HCV (n = 52) infected patients and ex vivo direct-acting antivirals (DAA’s) treatment , metabolic flux and metabolic checkpoint were estimated in vitro. Outcomes showed that HBV particular (core18-27-and polymerase455-461)) and HCV particular (NS3 1073-1081-, NS31406-1415- and NS5B2594-2602-) CD8+ T cells reactions illustrated heterogenous metabolic profiles correlated with their exhaustion status profiles instead of causation of infections. Regarding mitochondrial impairment although there was pronounced nondamaged glucose uptake present in robustly exhausted T cell correlating with liver inflammation in cHCV infections and in HBV polymerase455-461 particular T cell reactions, contrarily germane metabolic fitness was found at HBeAg- infection in HBV core18-27 particular reactions. DAA’s treatment showed partly improvement in mitochondrial programming in robustly exhausted HCV particular T cells. Enolase got isolated as a metabolic checkpoint in exhausted T cell. Metabolic bypassing caused improvement of glycolysis and T cell effector working taking place. Akin enolase insufficiency was found in intrahepatic HBV particular CD8+ T cells in a murine model of chronic infection.Thus concluding metabolism of HBV particular/ HCV particular Tcells is robustly correlated with their robustness of exhaustion .They correlate differential bioenergetic fitness with unique exhaustion subkinds and different liver disease with repercussions on treatment approaches.
Keywords: Exhausted CD8+ T cells; cHCV; c HBV; Enolase Insufficiency
Previously we reviewed CRISPR/Cas9 system for the treatment of HBV in addition to part of epigenetic treatments for, and reviewed the generation and the epigenetic controlling of ccc DNA microchromosome, the manner host and viral factors impact transcription besides if utilization of epigenome editing could be done for silencing HBV ccc DNA forever and why persistence of HBV takes place followed by ’targeting dysfunctional mitochondrial metabolism of hepatocytes caused by hepatitis B virus (HBV) in the treatment of the Chronic HBV and finally detailed Chronic HBV treatment in exhaustive details [1-4].
Exhausted virus particular CD8+ T cells (TEX) with restricted effector working accrual takes place in patients with chronic Hepatitis B virus (cHBV) as well as Hepatitis C virus (cHCV)infections [5,6]. Such exhausted T cells possess the properties of escalated PD1 (programmed death1) in addition to other cohampering receptors as well as intense changes in the transcriptional programmes [5,7]. Recent documents emphasized considerable heterogeneity amongst HBV particular along with HCV particular exhausted CD8+T cells inclusive of early differentiated PD1+ CD 127 + precursors of exhausted T having partial memory like properties in addition to substantially greater robust PD1hi CD 127 - T cells cells [7,8-10]. Intriguingly, plethora of cellular changes of exhausted CD8+ T cells continue despite subsequent to receipt of anti viral treatment [10,11].
Previously it had been detailed that accrual of exhausted CD8+ T cells in patients with chronicc HBV as well as cHCV infections (as depicted in figure 1 and 2) [10,12,13]. Nevertheless, the exact mechanistic modes which estimate such exhausted T cell programmes continue to be uncharted.
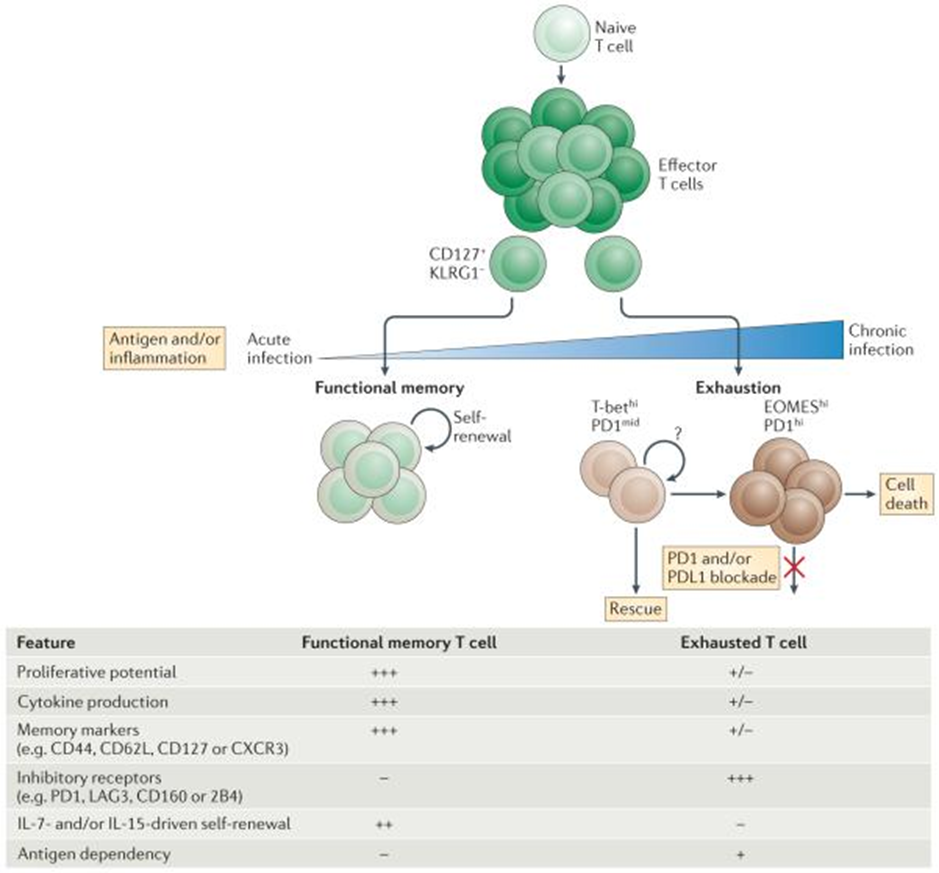
Figure 1: Courtesy ref no- 12-Progressive development of T cell exhaustion Upon infection, naive T cells are activated by antigen, co-stimulation and inflammation, and they exponentially proliferate to form effector populations1,2. Whereas the majority of effector CD8+ T cells that express killer cell lectin-like receptor subfamily G member 1 (KLRG1) die during the contraction phase, a population of effector CD8+ T cells that retains CD127 expression can give rise to memory or exhausted CD8+ T cells. In the setting of acute infection, where antigen and/or inflammation is cleared, effector CD8+ T cells further differentiate into functional memory CD8+ T cells that can produce multiple cytokines (such as interferon-γ (IFNγ), tumour necrosis factor (TNF) and interleukin-2 (IL-2)) and mount robust recall responses upon secondary infection. These memory T cells are also maintained efficiently long term without antigen via IL-7- and IL-15-driven homeostatic self-renewal. By contrast, during chronic infection, antigen and inflammation persist after the effector phase. As infection progresses and T cell stimulation continues, T cells lose effector functions in a hierarchical manner and become exhausted. Typically, functions such as IL-2 production and cytokine polyfunctionality, as well as high proliferative capacity, are lost early; this is followed by defects in the production of IFNγ, TNF and chemokines, as well as in degranulation. T cell exhaustion is also accompanied by a progressive increase in the amount and diversity of inhibitory receptors that are expressed, including programmed cell death protein 1 (PD1), lymphocyte activation gene 3 protein (LAG3), 2B4, CD160 and T cell immunoreceptor with immunoglobulin and ITIM domains (TIGIT). Ultimately, if the severity or duration of the infection is high or prolonged, virus-specific T cells can be lost (‘deletion’). Variables-such as the level and number of inhibitory receptors expressed, strength of antigen stimulation, availability of CD4+ T cell help and the duration of infection-can all influence the severity of exhaustion. Exhausted T cell populations are heterogeneous, and subsets of T-bethi PD1mid and EOMEShi PD1hi CD8+ exhausted T cells exist. Only the T-bethi PD1mid subset is responsive to reinvigoration by blockade of the PD1 pathway. CXCR3, CXC-chemokine receptor 3; PDL1, PD1 ligand 1.
![Figure 2:Courtesy ref no- 13-Quality of CD8+ T cell responses in resolving vs. chronic HCV infection (upper panel) and potential strategies aimed at restoration of exhausted T cell function in chronic HCV infection (lower panel). PD1 ;programmed death1 ;Tim-3; T cell immunoglobulin and mucin-domain containing-3 LAG-3; lymphocyte-activation gene 3, iR -inhibitory receptor ;2B4/CD244;NK cell type I receptor protein
There is existence of an intricate connection amongst energy metabolism in addition to working of effector T cells. Particular part of glycolytic enzymes in the activation of T cells as well as cytokines generation have been detailed earlier for instance that of glyceraldehyde phosphate pyruvate dehydrogenase (GADPH) [14], pyruvate dehydrogenase kinase (PDHK) [15]or the glycolytic metabolite phosphoenol pyruvate (PEP) [16]. On the other hand, controlling of the metabolic flux might offer the reasoning for the restricted T cell working. Actually, bioenergetic controlling downstream of hampering receptors signaling was isolated as a substantial emblem of exhausted T cells in the murine lymphocytic choriomeningitis virus (LCMV) model of chronic viral infections [17]. Such bioenergetic controlling influenced glycolysis as well as caused considerable interference with mitochondrial organelles with changes in the ultrastructure, membrane depolarization in addition to generation of reactive oxygen species (ROS) [16,17]. Asssessment of the metabolic characteristics of HBV particular as well as HCV particular CD8+ T cells isolated correlated with metabolic decontrolling. In vitro evaluation of HBV particular CD8+ T cells possessed a considerable dependence on glycolysis along with incapability of switching with efficacy to oxidative phosphorylation (OXPHOS) in the clinical scenario of glucose restriction [18]. Fisicaro P., et al. [19], isolated that a substantially significant downregulation of mitochondrial working is correlated with ROS generation from exhausted HBV particular CD8+ T cells which might be compared to the observations in case of LCMV infection [19]. HBV particular CD8+ T cells targeting separate epitopes for instance HBV core18-27 or polymerase455-461 particular reactions vary in reference to their exhaustion phenotype [9], however their metabolic characteristics continue to be uncharted. Mitochondrial working was further evaluated in HCV particular CD8+ T cells in addition to at the time of treatment with direct-acting-antivirals (DAA’s). Whereas, in one study it got documented that restricted alterations in mitochondrial working of HCV particular CD8+ T cells occurred subsequent to DAA’s treatment along with clearance of HCV [11], one further study found diminished cells with mitochondria that got depolarized [20]. Nevertheless, presently it continues to be uncharted if existence of variations occurs in the metabolic controlling of HBV particular as well as HCV particular CD8+ T cells, the manner they correlate with the robustness of exhaustion programmes, if alterations take place at the time of anti viral treatment as well as if particular glycolytic checkpoint are implicated.](https://actascientific.com/ASGIS/images/ASGIS-07-0674_figure2.png)
Figure 2: Courtesy ref no- 13-Quality of CD8+ T cell responses in resolving vs. chronic HCV infection (upper panel) and potential strategies aimed at restoration of exhausted T cell function in chronic HCV infection (lower panel). PD1 ;programmed death1 ;Tim-3; T cell immunoglobulin and mucin-domain containing-3 LAG-3; lymphocyte-activation gene 3, iR -inhibitory receptor ;2B4/CD244;NK cell type I receptor protein There is existence of an intricate connection amongst energy metabolism in addition to working of effector T cells. Particular part of glycolytic enzymes in the activation of T cells as well as cytokines generation have been detailed earlier for instance that of glyceraldehyde phosphate pyruvate dehydrogenase (GADPH) [14], pyruvate dehydrogenase kinase (PDHK) [15]or the glycolytic metabolite phosphoenol pyruvate (PEP) [16]. On the other hand, controlling of the metabolic flux might offer the reasoning for the restricted T cell working. Actually, bioenergetic controlling downstream of hampering receptors signaling was isolated as a substantial emblem of exhausted T cells in the murine lymphocytic choriomeningitis virus (LCMV) model of chronic viral infections [17]. Such bioenergetic controlling influenced glycolysis as well as caused considerable interference with mitochondrial organelles with changes in the ultrastructure, membrane depolarization in addition to generation of reactive oxygen species (ROS) [16,17]. Asssessment of the metabolic characteristics of HBV particular as well as HCV particular CD8+ T cells isolated correlated with metabolic decontrolling. In vitro evaluation of HBV particular CD8+ T cells possessed a considerable dependence on glycolysis along with incapability of switching with efficacy to oxidative phosphorylation (OXPHOS) in the clinical scenario of glucose restriction [18]. Fisicaro P., et al. [19], isolated that a substantially significant downregulation of mitochondrial working is correlated with ROS generation from exhausted HBV particular CD8+ T cells which might be compared to the observations in case of LCMV infection [19]. HBV particular CD8+ T cells targeting separate epitopes for instance HBV core18-27 or polymerase455-461 particular reactions vary in reference to their exhaustion phenotype [9], however their metabolic characteristics continue to be uncharted. Mitochondrial working was further evaluated in HCV particular CD8+ T cells in addition to at the time of treatment with direct-acting-antivirals (DAA’s). Whereas, in one study it got documented that restricted alterations in mitochondrial working of HCV particular CD8+ T cells occurred subsequent to DAA’s treatment along with clearance of HCV [11], one further study found diminished cells with mitochondria that got depolarized [20]. Nevertheless, presently it continues to be uncharted if existence of variations occurs in the metabolic controlling of HBV particular as well as HCV particular CD8+ T cells, the manner they correlate with the robustness of exhaustion programmes, if alterations take place at the time of anti viral treatment as well as if particular glycolytic checkpoint are implicated.
For answering this query Winkler F., et al. [21], conducted in detail evaluation of the metabolic profiles of HBV particular as well as HCV particular CD8+ T cells in addition to their exhaustion status .Their observations were mainly variations in the exhaustion along with metabolic profiles of HBV particular as well as HCV particular CD8+ T cells .HCV particular reactions possessed enrichment for greater robust phenotype in addition to communicated with greater magnitude of mitochondrial dysfunction despite substantially greater glucose uptake. Nevertheless, akin mitochondrial dysfunction was found in HBV polymerase455-461 particular CD8+ T cells, however not in HBV core18-27 particular CD8+ T cells at the time of HBeAg- infection. Such variations were communicated with greater robust exhaustion as well as in case of cHCV to a greater magnitude of liver inflammation . In case of HBV infection, an association amongst HBV polymerase455-461 particular CD8+ T cells metabolism as well as quantitative Hepatitis B surface antigen (qHBsAg), amounts were found. Elimination of antigen in vivo at the time of DAA’s treatment resulted in part improvement of metabolism of the greater robust exhausted T cell subsets. Enolase was isolated in the form of metabolic checkpoint. Diminished expression of enolase in robustly exhausted T cells is responsible for controlling of the glycolytic flux which aids in metabolic impairment in addition to decreased anti viral effector working. By passing such metabolic blockade reinforced effector working of virus particular CD8+ T cells in chronic however not in acute infection. Overall such observations emphasize the differential metabolic programming of virus particular CD8+ T cells in exhausted T cells in various subsets in viral hepatitis [21] (Figure3-6).
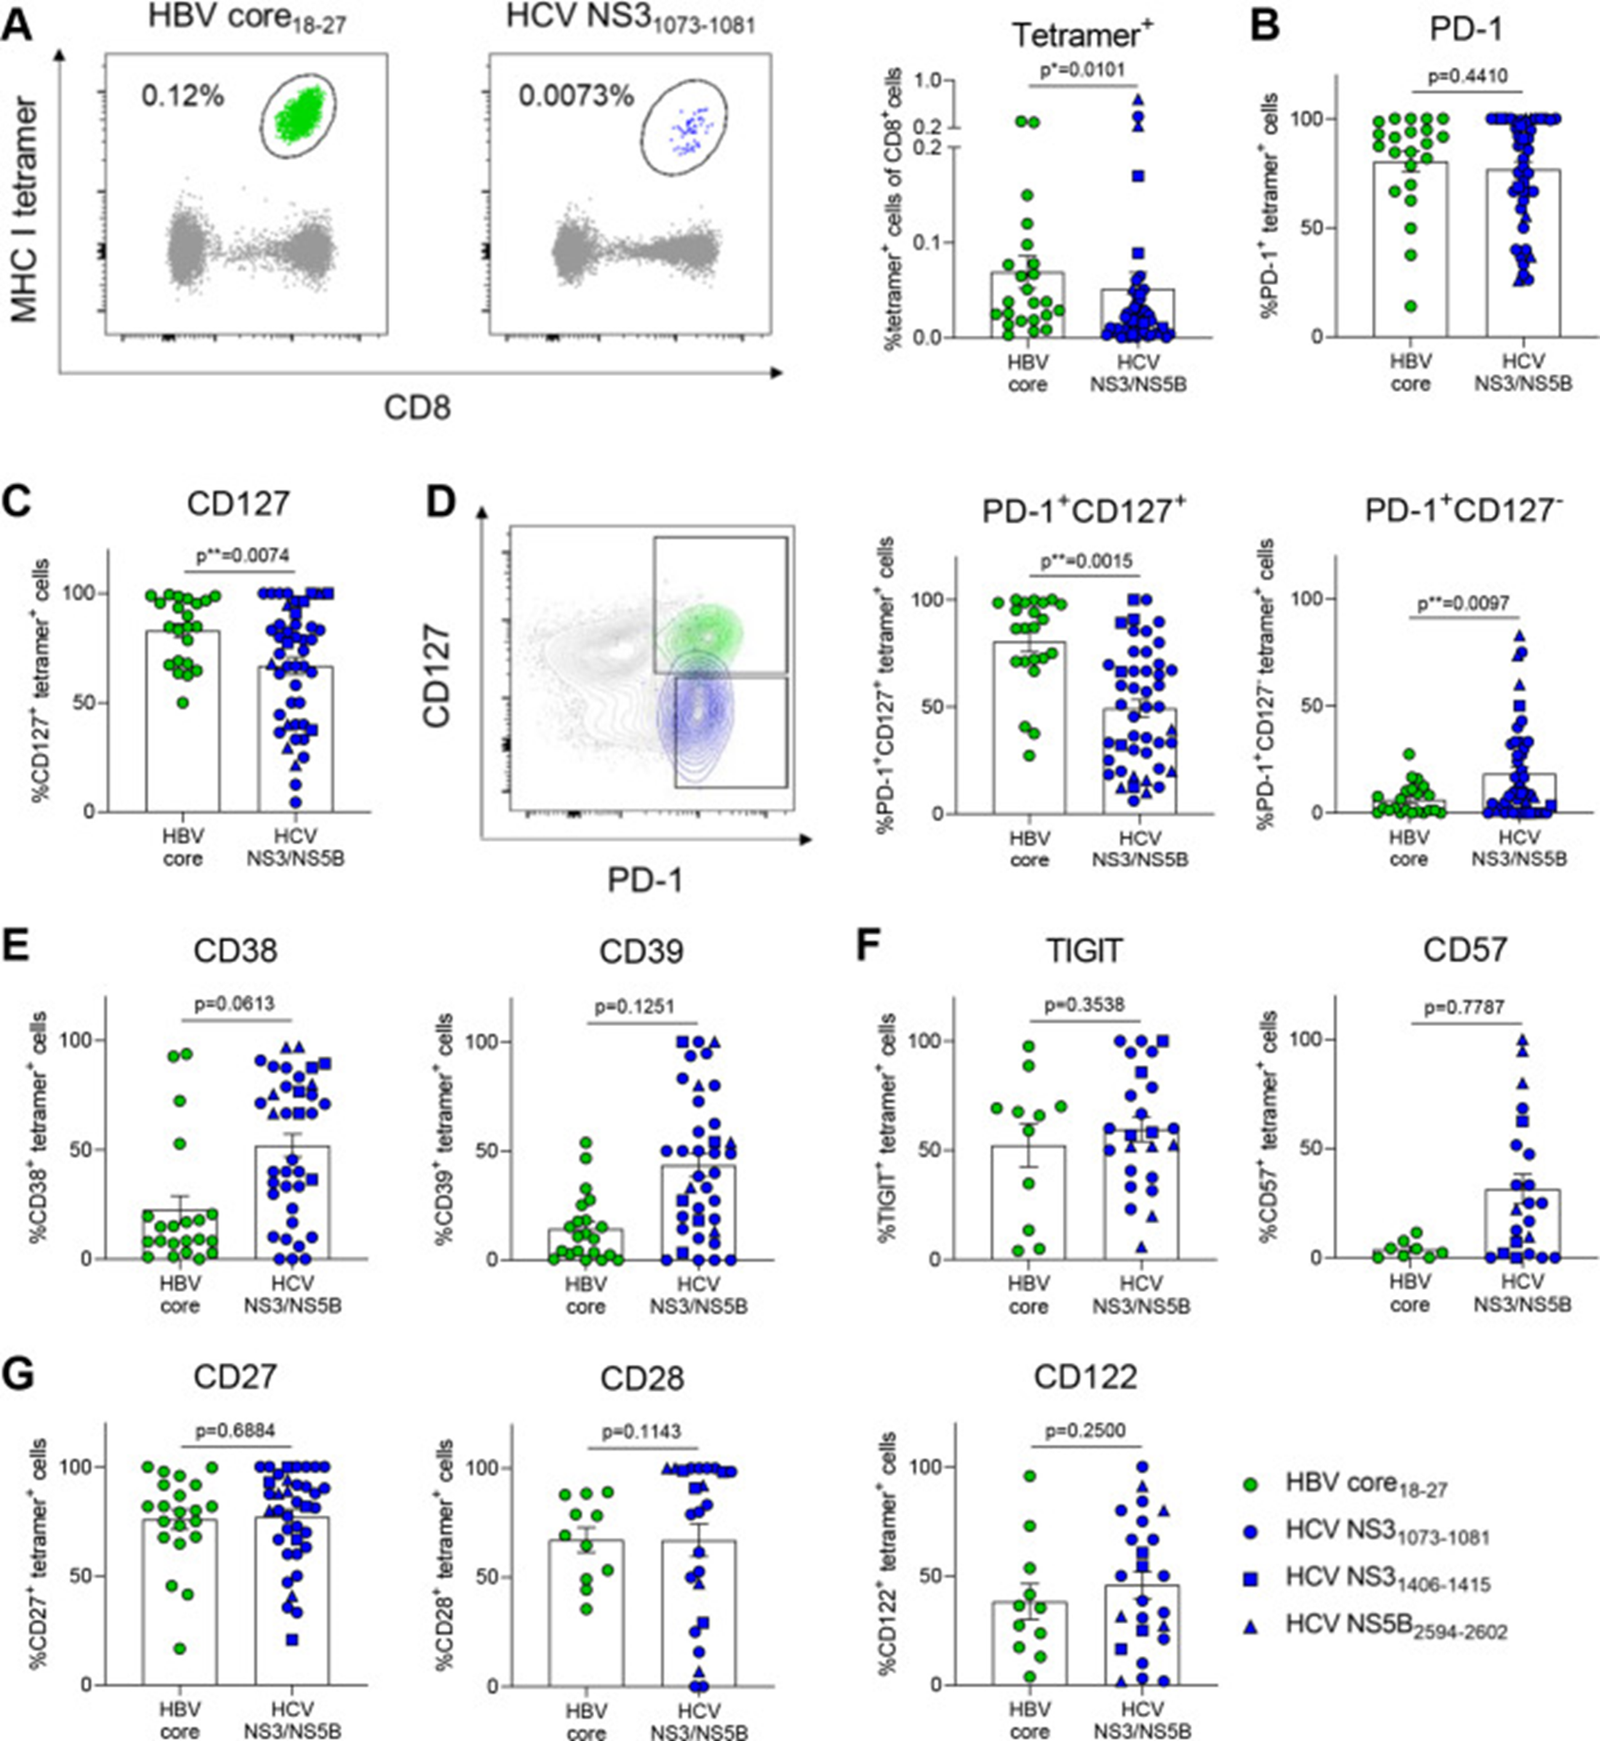
Figure 3: Courtesy ref no-21- HCV-specific CD8+ T cells express markers associated with severe exhaustion. (A) Tetramer analysis of PBMCs from therapy-naïve cHBV and cHCV patients. Representative FACS plots of HBV core18-27- and HCV NS31073-1081-specific CD8+ T cells (left). Comparison of tetramer frequencies gated on CD8+ T cells (right). Virus-specific CD8+ T cells from cHBV and cHCV patients were stained for the depicted exhaustion-associated molecules. (B, C) Frequencies of PD-1+, CD127+, (D) PD-1+CD127+, PD-1+CD127-, (E) CD38+, CD39+, (F) TIGIT+, CD57+, (G) CD27+, CD28+ and CD122+ virus-specific CD8+ T cells are indicated. HBV core18-27 (green) and HCV NS31073-1081 epitopes (blue) are represented by circles. HCV NS31406-1415 and HCV NS5B2594-2602 epitopes are visualised by blue squares and triangles, respectively. Mann-Whitney test was performed in (A, B), (D, E) and (G, left). Unpaired t-test was performed in (C), (F, G, centre and right). P values are indicated (p* < 0.05, p** < 0.01). Error bars indicate mean ± SEM. cHBV, chronic hepatitis B virus; cHCV, chronic hepatitis C virus; PBMCs, peripheral blood mononuclear cells.
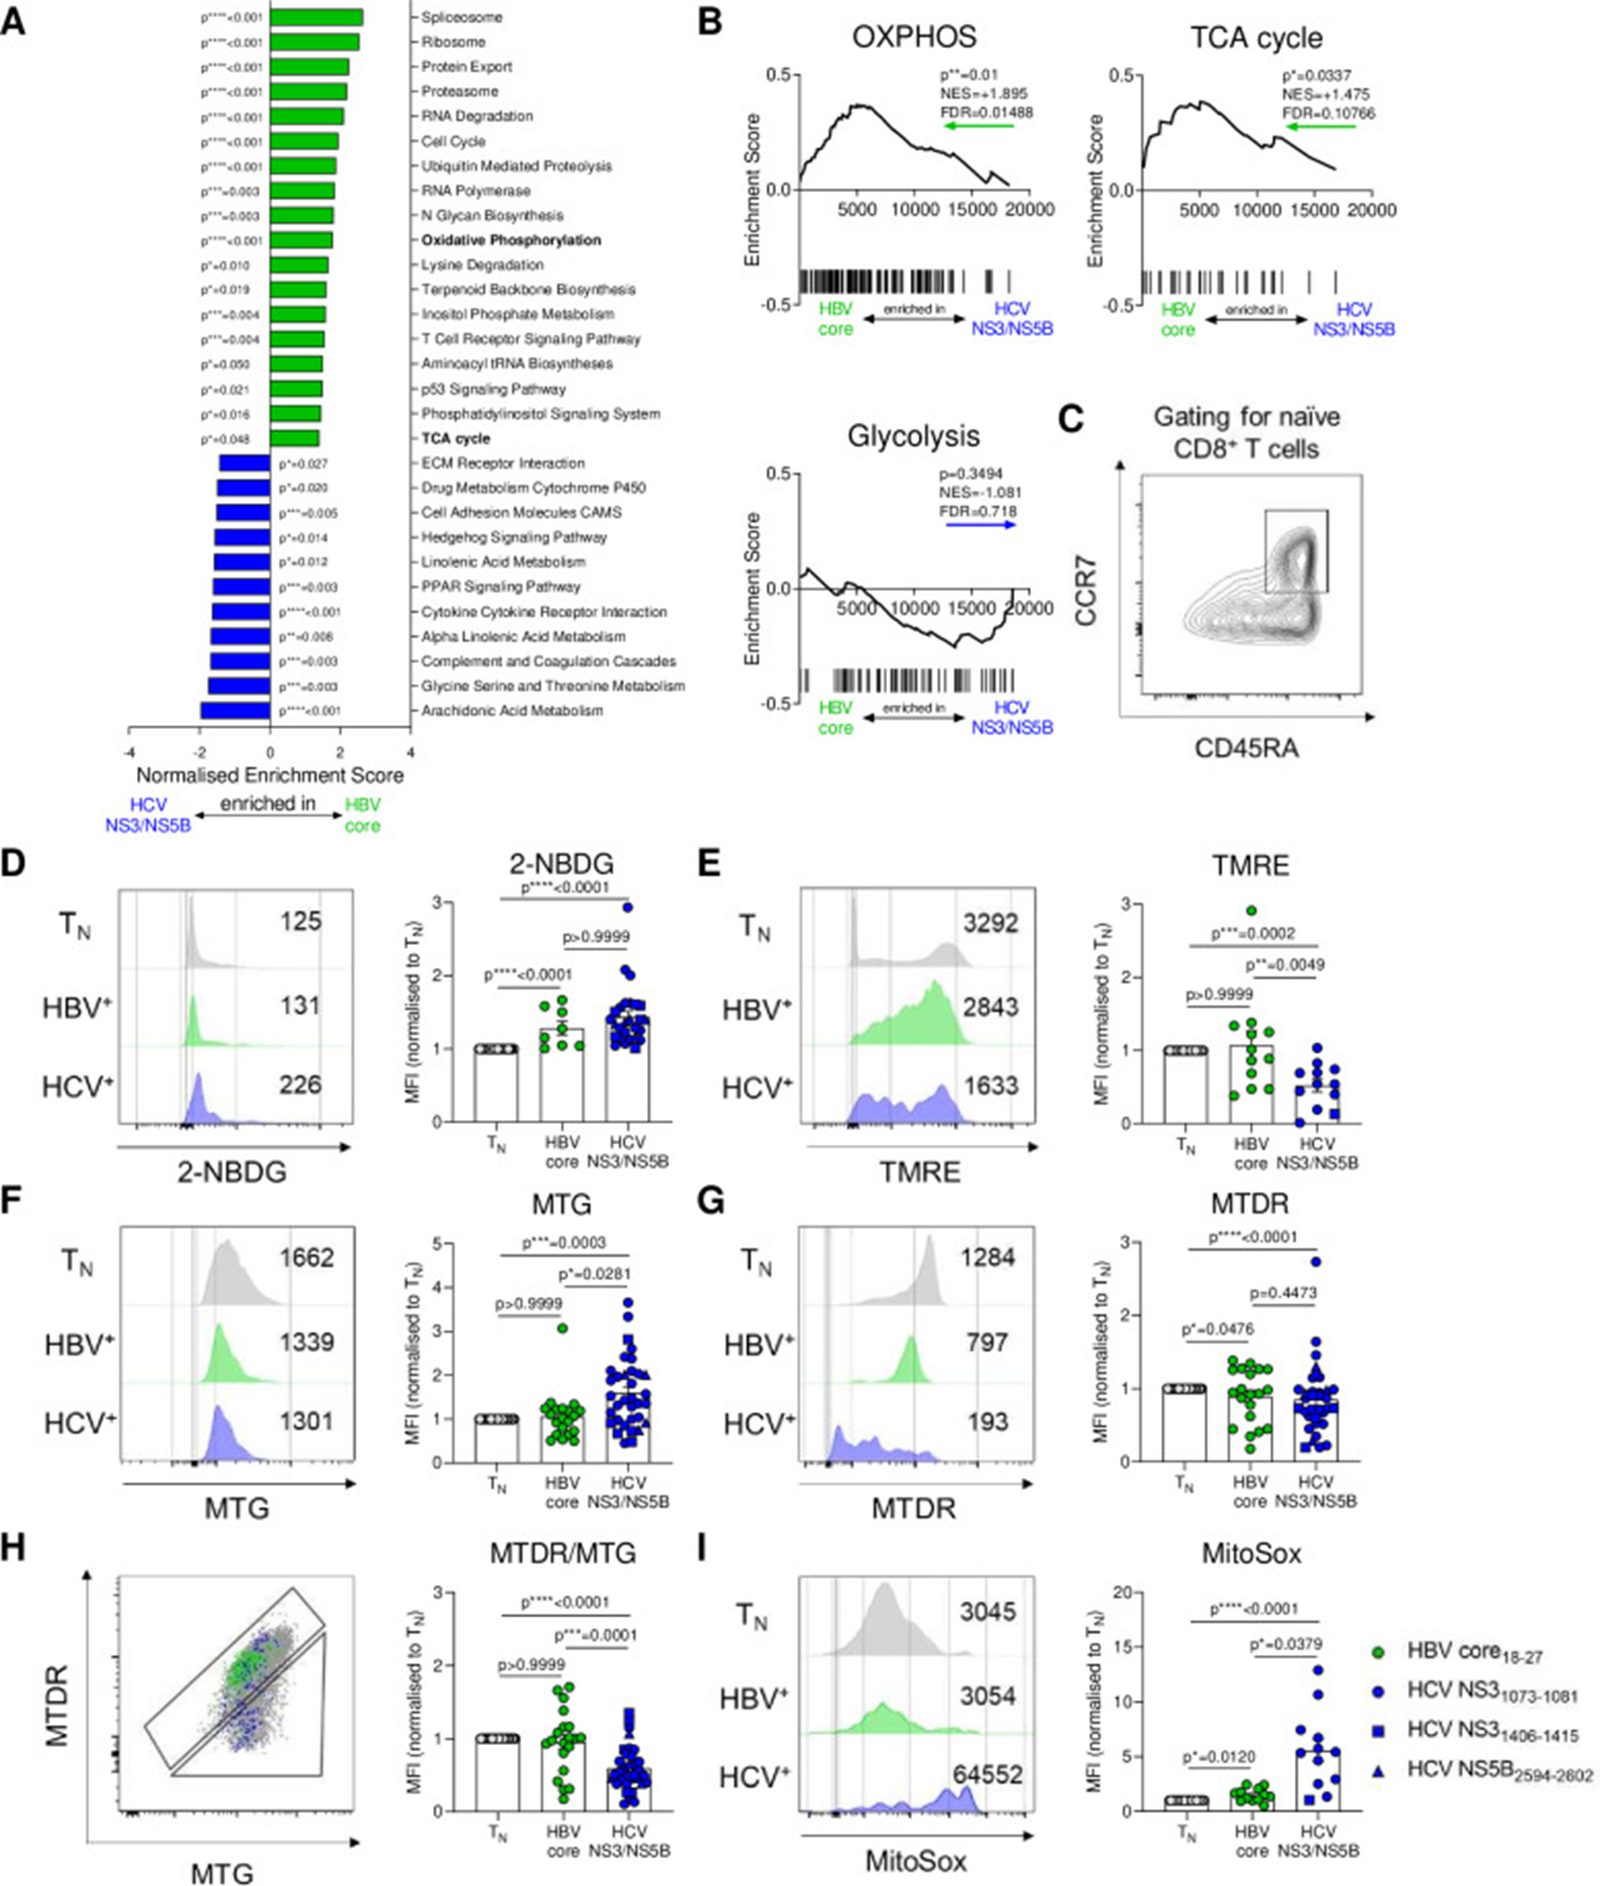
Figure 4: Courtesy ref no- 21-HBV-specific and HCV-specific CD8+ T cells display different metabolic profiles. (A) Gene-set enrichment analyses (GSEA) of KEGG metabolic pathways were performed on microarray data of sorted therapy-naïve HBV-specific and HCV-specific CD8+ T cells. Significant (p≤0.05) pathways were indicated. (B) GSEA plots for KEGG OXPHOS, TCA cycle and Glycolysis gene sets. Coloured arrows indicate enrichment in HBV-specific or HCV-specific CD8+ T cells. Normalised enrichment scores (NES), false discovery rates (FDR) and p values are shown for GSEA analyses. (C) Naïve CD8+ T cells used as normalisation control for metabolic stainings were gated as CCR7+CD45RA+. (D) Virus-specific CD8+ T cells were analysed for metabolic features by staining for glucose uptake (2-NBDG), (E) mitochondrial membrane potential (TMRE), (F) mitochondrial mass (MTG), (G) mitochondrial mass and potential (MTDR), (H) polarisation (MTDR/MTG) and (I) mitochondrial ROS (MitoSox). Metabolic staining intensity was normalised to naïve CD8+ T cells from the same sample. Exemplary histograms of metabolic stainings are shown. HBV core18-27 (green) and HCV NS31073-1081 epitopes (blue) are represented by circles. HCV NS31406-1415 and HCV NS5B2594-2602 epitopes are visualised by blue squares and triangles, respectively. Kruskal-Wallis test was performed in (D–I). P values are indicated (p*<0.05, p**<0.01, p***<0.005, p****<0.001). Error bars indicate mean±SEM. HBV, hepatitis B virus; HCV, hepatitis C virus; ROS, reactive oxygen species.
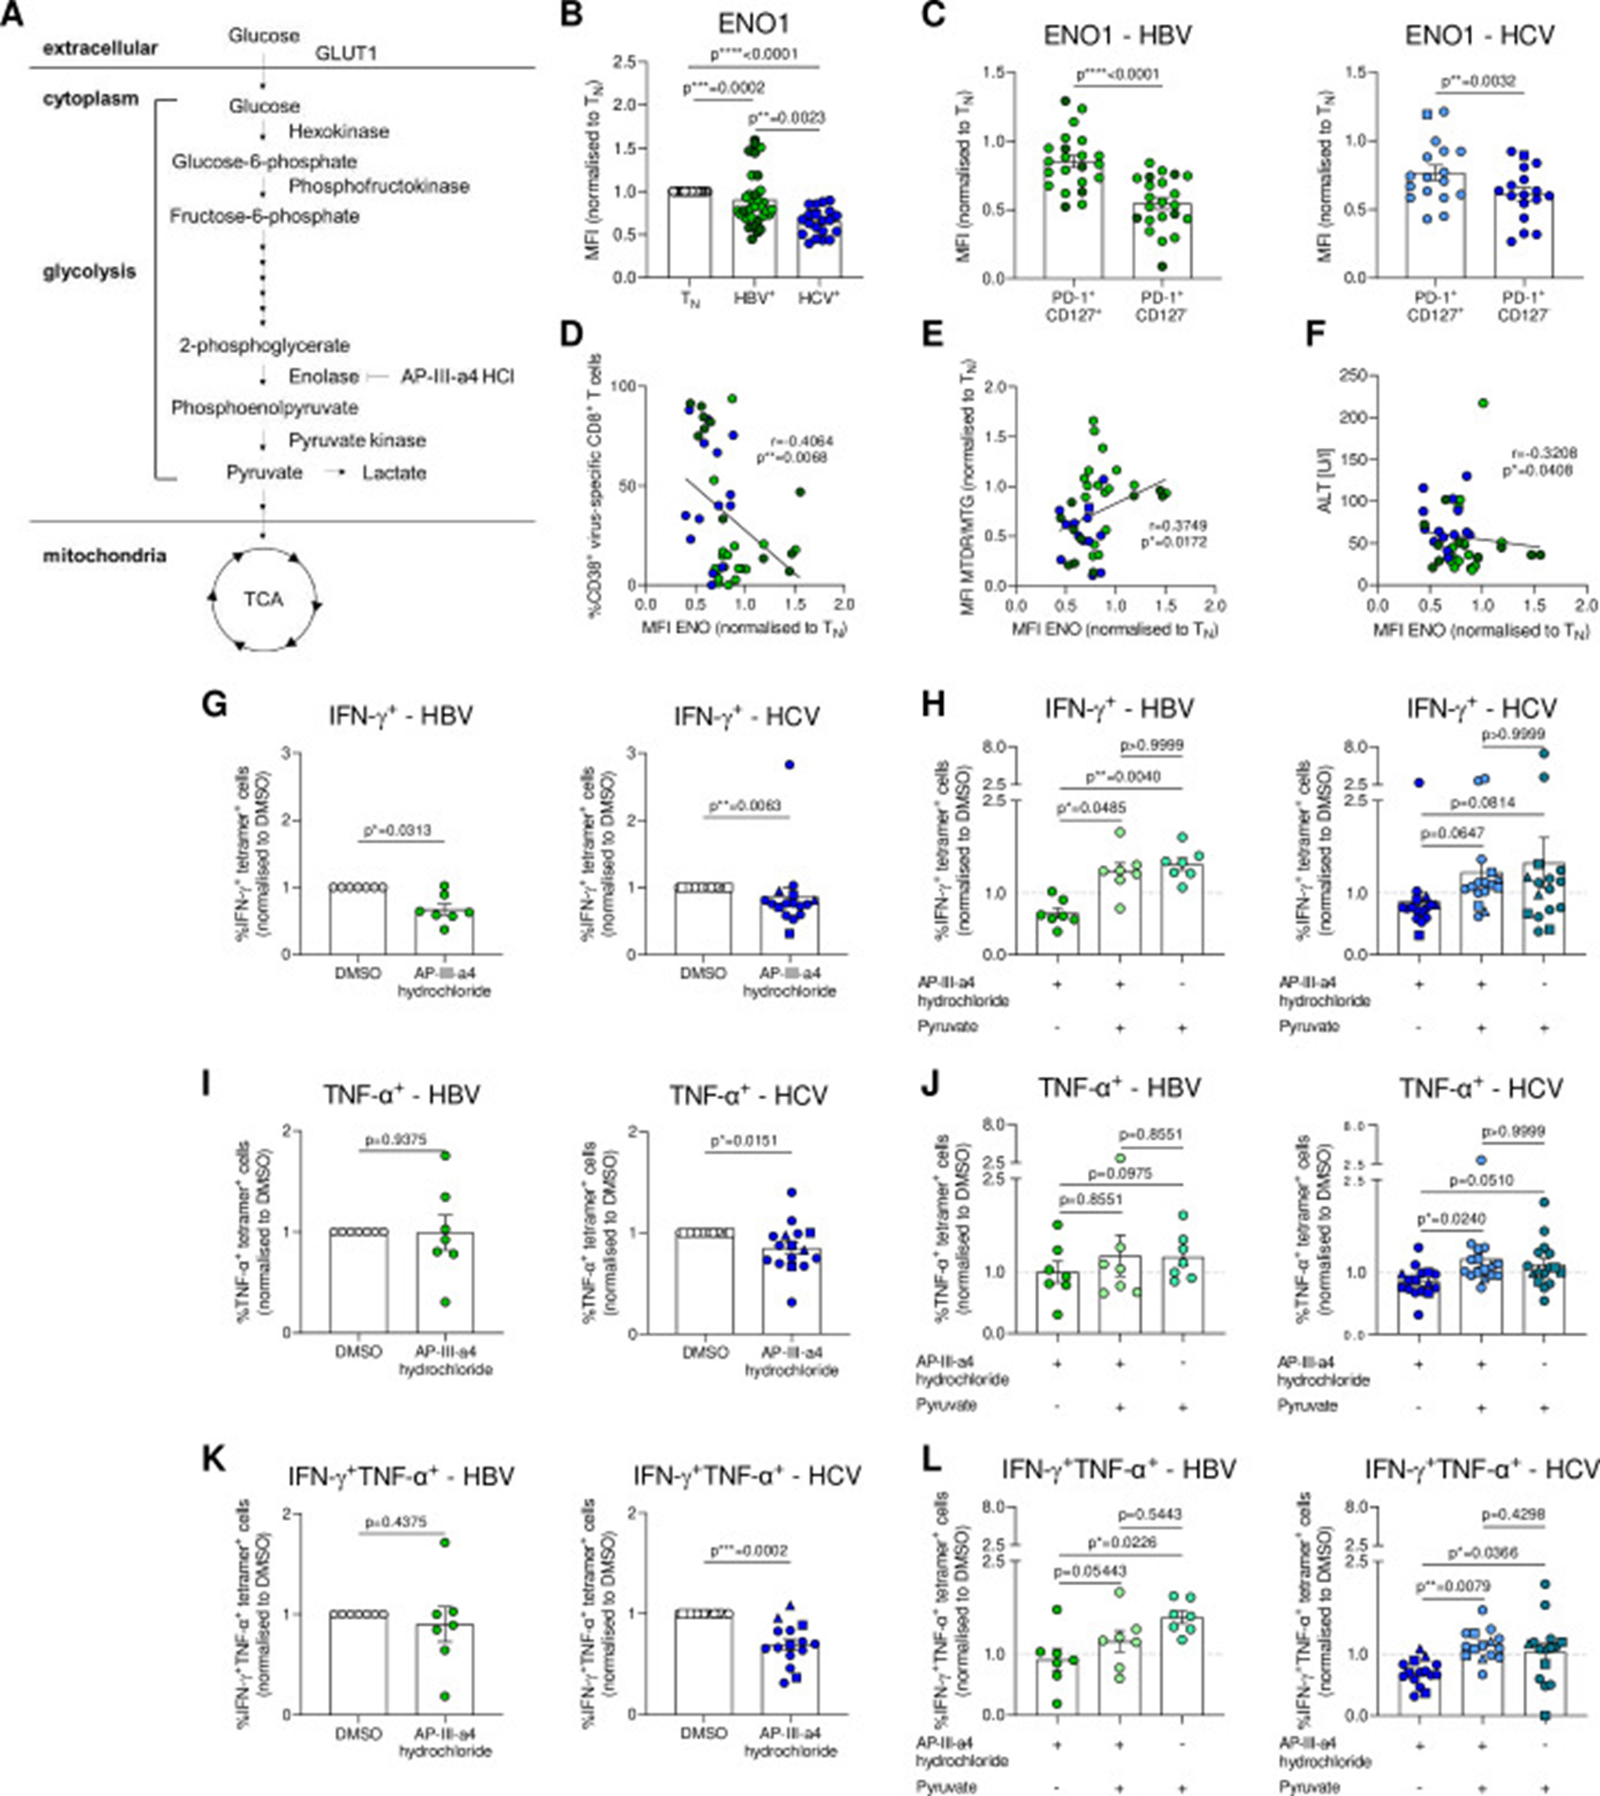
Figure 5: Courtesy ref no- 21-ENO1 lowly expressed in severely exhausted virus-specific CD8+ T cells is a metabolic checkpoint controlling glycolytic flux and T cell function. (A) Schematic overview of the glycolytic pathway. (B) Intracellular ENO1 staining of HBV-specific and HCV-specific CD8+ T cells. ENO1 MFIs are normalised to naïve CD8+ T cells of the respective donor. (C) Ex vivo analysis of PD-1+CD127+ and PD-1+CD127- subsets of HBV-specific and HCV-specific CD8+ T cells for ENO1 expression. (D) Correlation analyses of ENO1 expression and frequencies of CD38+ virus-specific CD8+ T cells. (E) Correlation analyses of ENO1 expression and mitochondrial polarisation (MTDR/MTG) of HBV-specific and HCV-specific CD8+ T cells. (F) Correlation analysis of ENO1 expression and serum ALT level of therapy-naïve cHBV and cHCV patients. (G–L) IFN-γ and TNF-ɑ production of PMA-stimulated and ionomycin-stimulated hepatitis virus-specific CD8+ T cells after o/n treatment with DMSO, AP-III-a4 hydrochloride (10 µM) and/or sodium pyruvate (2 mM). Cytokine secretion is shown normalised to DMSO-treated hepatitis virus-specific CD8+ T cells as control samples. HBV core18-27- and polymerase455-463-specific CD8+ T cells are visualised by light green and dark green circles, respectively. HCV NS31073-1081, HCV NS31406-1415 and HCV NS5B2594-2602 epitopes are represented by blue circles, squares and triangles, respectively. Kruskall-Wallis test was performed in (B). Paired t-test was performed in (C). Spearman r correlation analyses were performed in (D–F). Wilcoxon test was performed in (G), (I, K). Friedman test was performed in (H), (J) and (L, left). Two-way ANOVA was performed in (L, right). P values are indicated (p* < 0.05, p** < 0.01, p*** < 0.005, p**** < 0.001). Error bars indicate mean ± SEM. ANOVA, analysis of variance; cHBV, chronic hepatitis B virus; HCV, hepatitis C virus.
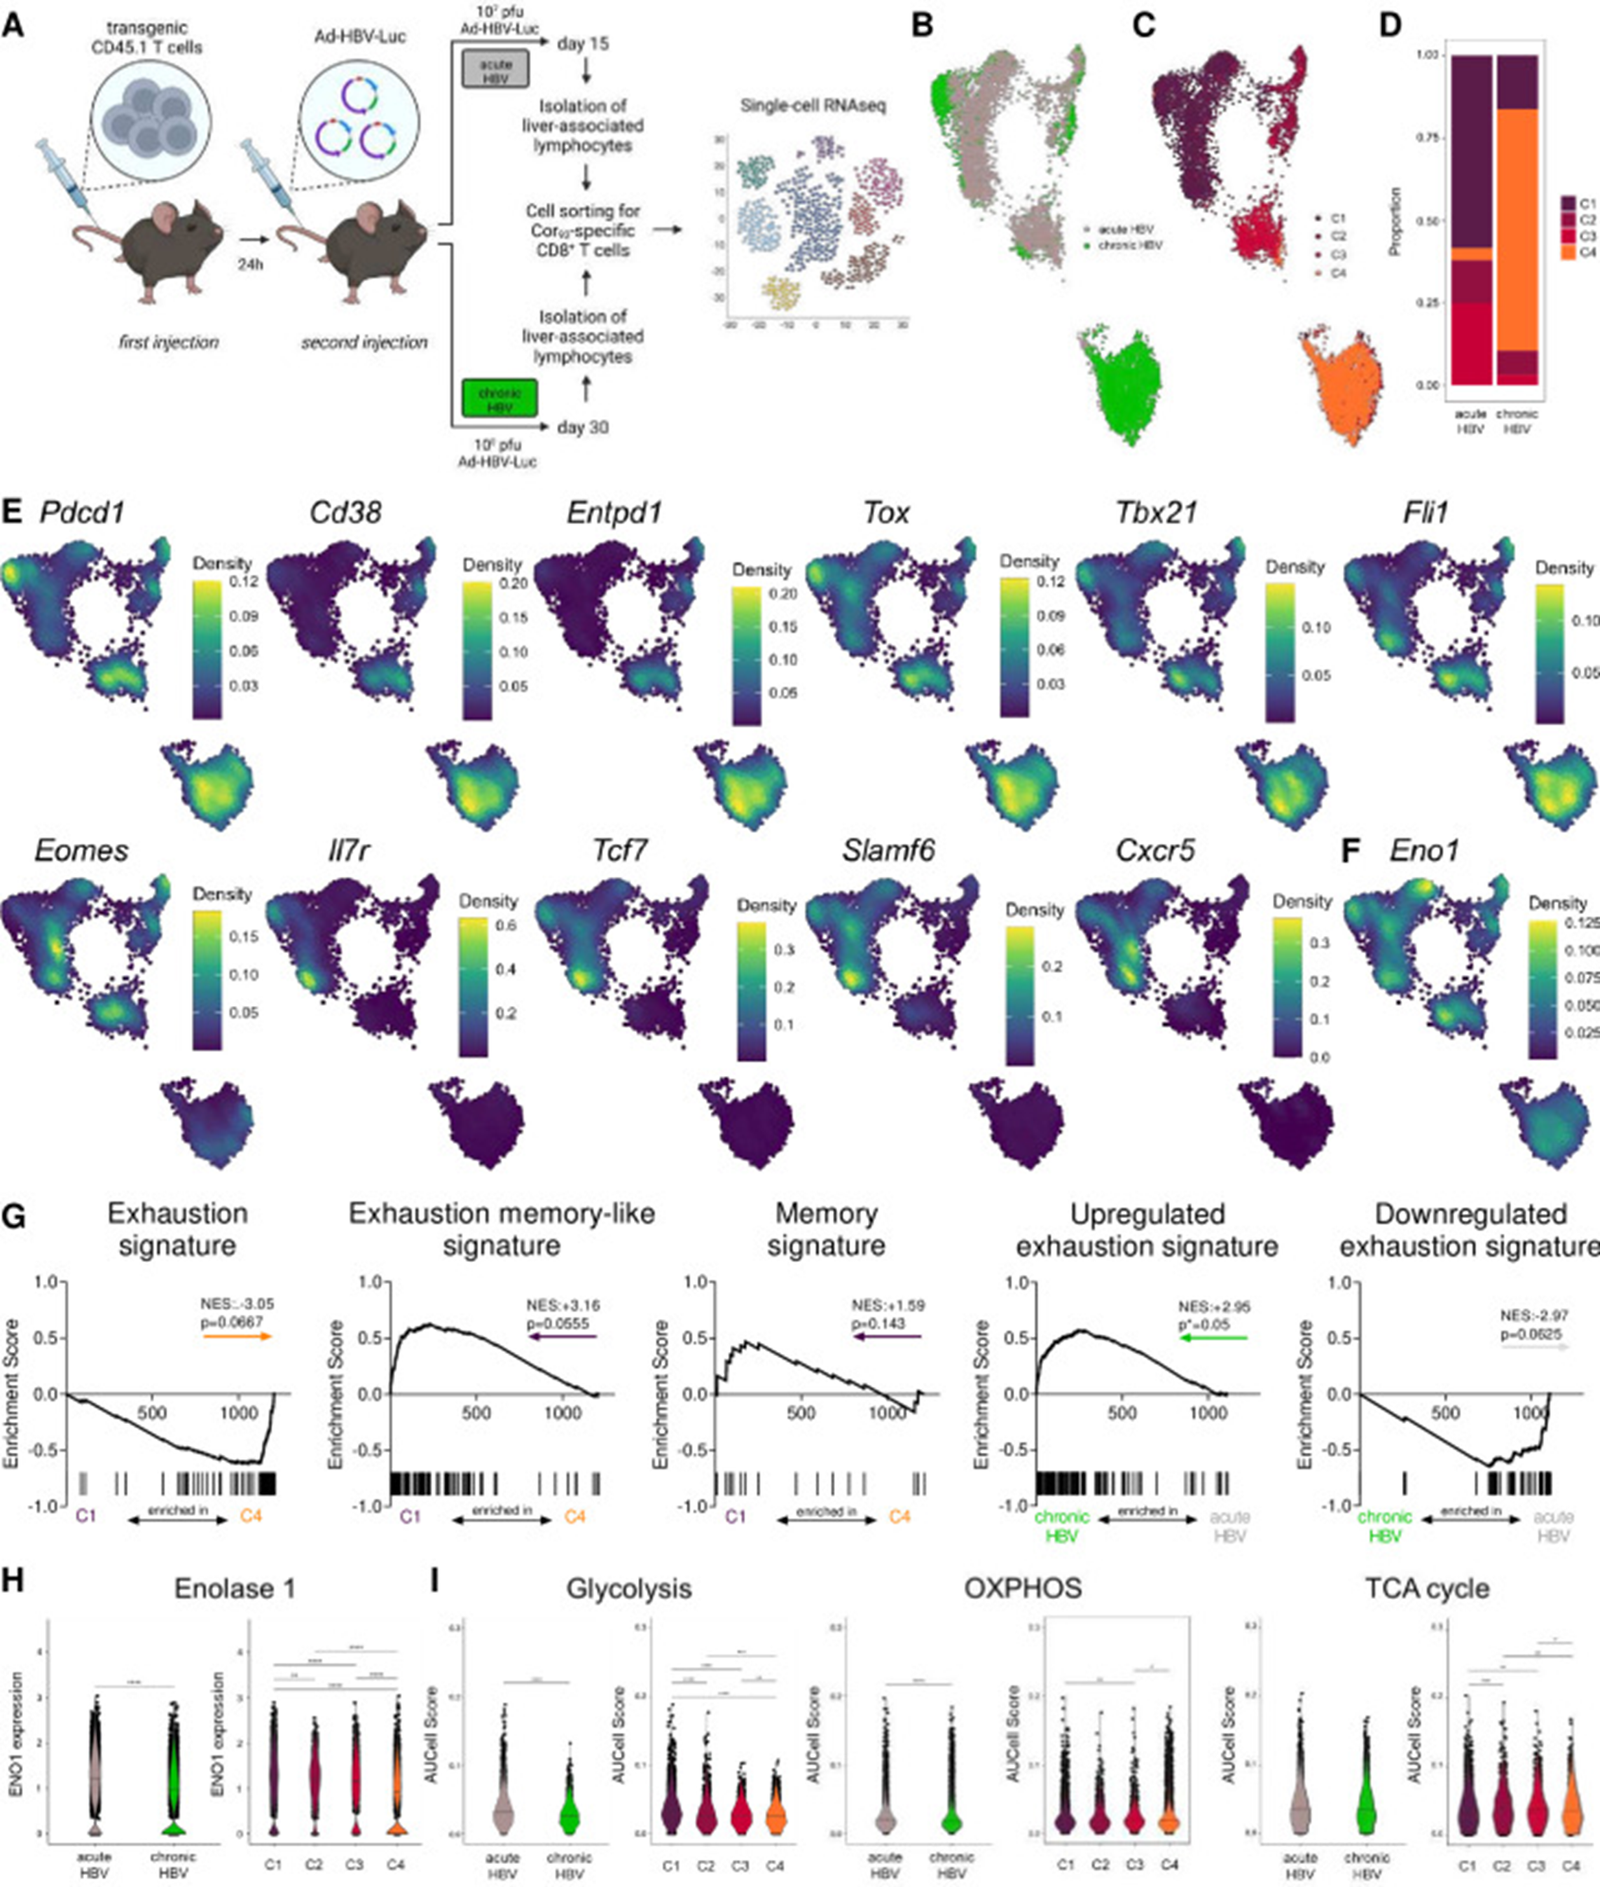
Figure 6: Courtesy ref no- 21-Differential enolase 1 expression is linked to different metabolic programmes and exhaustion severities in acute versus chronic HBV infection. (A) Schematic illustration depicting experimental procedure. C57Bl/6 mice were intravenously injected with 10 000 transgenic CD45.1 T cells derived from Cor93 TCR-transgenic mice and after 24 hours infected with 107 (acute self-limiting) or 108 pfu (chronic) of adenoviral vector (Ad-HBV-Luc). Liver-associated lymphocytes were isolated after 15 (acute) or 30 days (chronic) and subsequently sorted for Cor93-specific CD8+ T cells. Single-cell RNA sequencing was performed on 3000 Cor93-specific cells per mouse. (B) UMAP projection showing Cor93-specific CD8+ T cells coloured by condition (C) and cluster identity. (D) Ratio of the number of cells in each cluster in acute and chronic samples. (E) Densities of gene expression levels are visualised by Nebulosa for selected genes and (F) Eno1. (G) GSEA plots comparing the differentially expressed genes (DEGs) for cluster 1 (C1) versus cluster 4 (C4) with the signatures reported in Utzschneider et al. 22 (Exhaustion, Exhaustion memory-like and Memory signatures) and the DEGs of acute versus chronic conditions compared with the signatures published in Bengsch et al. 23 (Upregulated and downregulated epigenomic exhaustion signatures). Coloured arrows indicate the cluster or condition in which the gene set is enriched. (H) Enolase 1 expression in acute versus chronic setting and cluster 1–4 across conditions. (I) Pathway scores of glycolysis, TCA cycle and oxidative phosphorylation of acute versus chronic setting and among clusters. Mann-Whitney test was performed in (H–I). P values are indicated (p* < 0.05, p** < 0.01, p*** < 0.005, p****<0.001). HBV, hepatitis C virus.
T cell exhaustion is a pronounced characteristic of virus- particular CD8+ T cells in chronic HBV as well as HCV infection along with correlated with metabolic alterations. Here, by conducting a detailed contrasting of metabolic states of HBV core18-27 - particular in addition to polymerase455-461 - particular as well as HCV NS3 1073-1081- particular, NS31406-1415- particular along with NS5B2594-2602- particular CD8+ T cell reactions with pronounced mitochondrial decontrolling in robustly exhausted PD-1+CD127- CD8+ T cells having abundance of chronic HCV infection was performed. Comparison of greater mitochondrial fitness was found in PD1+CD127+ CD8+ T cells that have been known as ‘memory-like’ in view of their homeostatic features [7,20]. Intriguingly, the association amongst metabolism as well as exhaustion sub kind was independent of the viral aetiology. In cHCV infection, the metabolic state further associated with the magnitude of liver inflammation. In cHBV infection, they found separate parts –for separate HBV particular CD8+ T cell reactions. Specifically, HBV polymerase455-461 - particular CD8+ T cells demonstrated a greater robust mitochondrial impairment that associated with viral antigen quantities, whereas HBV core18-27 - particular CD8+ T cell reactions were abundant in thePD1+CD127+ exhaustion phenotype, had germanely intact metabolism however further did not demonstrate a clinical association. Overall such observations indicate a preserved mechanistic mode of metabolic programming in exhausted T cells across viral causations along with particular suggested particular metabolic checkpoints controlling separate exhaustion states. WinklerF., et al. [21], isolated differential enolase expression in the form of a plausible metabolic controller as well as posited it might regulate the exhaustion states. Actually, enolase hampering caused diminished metabolic flux in addition to mitochondrial depolarisation. Bypassing enolase controlling in HBV- particular HCV- particular CD8+ T cells accelerated their glycolysis in addition to T cell effector. Addition of such observations suggested that hepatitis virus- particular CD8+ T cells in cHBV as well as cHCV infection have separate exhaustion states in view of metabolic programmes. The isolation of enolase 1 in the form of an aiding controller of these exhaustion programmes might yield chance for targeted intervention. Continuation of antigen stimulation is a main guiding force for T cell exhaustion [24]. DAA therapy in chronic HCV infection causes fast hampering of viral replication along with acted in the form of an in vivo model for evaluation of the actions of tuning viral antigen in addition to associated liver inflammation. Their evaluation demonstrated that subsequent to 2 weeks of DAA treatment, improvement of HCV- particular CD8+ T cell metabolism was observed with escalated mitochondrial polarisation. The influence of DAA treatment on T cell metabolism has further been asssessed by Aregay., et al. [11], who, nevertheless, did not observe a main action on mitochondrial HCV- particular CD8+ T cell metabolism. [11]. In contrast, their DAA treatment outcomes fit to work was seen by Barili., et al. [20], who further found improvement of mitochondrial polarisation in HCV- particular CD8+ T cells by concentrating on epitope-matched virus- particular CD8+ T cell reactions [20]. In such studies, various kinds of exhaustion subsets were not asssessed exhaustively . In their work, the escalated mitochondrial fitness subsequent to DAA treatment possessed a clear cut correlation with an accrual of PD1+CD127+ virus- particular CD8+T cells. Nevertheless, their outcomes further pointed that greater exhausted subsets underwent greater robust improved metabolism by DAA treatment. Thus, various organizations of exhausted T cell subsets at baseline time points might aid in the variable outcomes observed in such previous studies. [11,20]. Intriguingly, while they found an association of the metabolic state of HCV- particular CD8+ T cells with liver inflammation that is interconnected with viral replication as well as antigen recognition, they did not find such an association with liver inflammation in chronic HBV infection. Nevertheless, in cHBV infection they found clearcut unique parts for HBV core18-27 particular in addition to polymerase455-46 particular reactions, in agreement with earlier outcomes from phenotypic as well as functional profiling [9]. HBV polymerase455-46 particular CD8+ T cell reactions demonstrated greater variable metabolic along with exhaustion states. Significantly, they further found association of activation as well as mitochondrial impairment in HBV polymerase455-46 particular CD8+ T cell reactions with qHBsAg quantities in these patients, pointing that the exhaustion state in addition to the associated metabolism of HBV polymerase455-46 particular -CD8+ T cell reactions takes place in view of magnitude of antigen recognition in cHBV infection. Such observations further point that antigen is a dominant driver of exhausted T cell metabolism in their cohort, despite aid of the inflammatory microenvironment, specifically in cHCV infection, cannot be formally ruled out. Glycolysis is crucial to effector T cell differentiation as well as function in addition to subject to regulation by immune checkpoints [16,17]. Here, in developed human chronic infection, their observations were of greater glucose uptake but diminished metabolic actions in robustly exhaustedCD8+ T cells. These cells illustrated significant mitochondrial disturbances akin to exhausted T cells in LCMV or tumor models [17,26] It was a conundrum that such exhausted T cells further had greater glucose uptake although they were restricted on glycolysis along with mitochondrial dysfunction, which stimulated them to dissect the glycolytic pathway. Their asssessment documented diminished ENO1 expression in robustly exhausted PD-1+ CD127- CD8+ T cells enriched in chronic HCV infection. Hampering of ENO1 resulted in diminished glycolytic working that could be reversed by downstream pyruvate supplementation. These results are in agreement with work that identified diminished enolase activity associated with inadequate effector working in tumour-infiltrating lymphocytes which got reverted subsequent to checkpoint treatment [25]. It further- is parallel with the belief that enolase might work in the form of a metabolic checkpoint, as illustrated by its part in the controlling of differentiation of regulatory T cells. [27]. Enolase is upstream of the generation of PEP, a glycolytic intermediate significantly important for sustaining T cell receptor-modulated Ca2+-NFAT (nuclear factor of activated T cells) signalling along with effector working by supressing the -sarcoplasmic/cytosolic endoplasmic reticulum Ca2+ -ATPase (SERCA2)- actions [16]. Diminished enolase action might thereby restrict calcium signalling which might in turn offer reasoning for the diminished T cell working observed subsequent to enolase hampering.
Certain particular HCV-CD8+ T cell reactions, with low glycolytic activity were metabolically nonreactive to enolase hampering, pointing to absence of enolase enzymatic action in those cells. Nevertheless, this was quite an extreme finding in their cohort, in view of maximum exhausted CD8+ T cell reactions had residual enolase activity. They further found diminished mitochondrial polarisation in addition to OXPHOS subsequent to overnight ENO1 hampering, pointing that enolase provides metabolic substrates for the TCA cycle as well as its controlling might be implicated in strangulating metabolic flux upstream of the mitochondrial alterations in exhausted T cells. Taking together, enolase works as a metabolic checkpoint of exhausted CD8+ T cells in viral hepatitis.
Their data demonstrate that HBV- particular as well as HCV- particular CD8+ T cells exhibit metabolic profiles during chronic infection associated with variations in their exhaustion programmes that are associated with antigen recognition in addition to in cHCV infection, with liver inflammation. They identified the glycolytic enzyme enolase in the form of an upstream metabolic checkpoint aiding in the controlling of metabolic as well as working programmes. Buttressing enolase function might portray an innovative approach to diminished effector working of virus- particular CD8+ T cells in chronic viral hepatitis.
Copyright: © 2024 Kulvinder Kochar Kaur. This is an open-access article distributed under the terms of the Creative Commons Attribution License, which permits unrestricted use, distribution, and reproduction in any medium, provided the original author and source are credited.
 Open Access by
Acta Scientific is licensed under a Creative Commons Attribution 4.0 International License
Open Access by
Acta Scientific is licensed under a Creative Commons Attribution 4.0 International License
Based on a work at https://actascientific.com
ff


