Ranjith Kumar Kanthem1, Sowjanya Lakkoju2*, Venkat bellam3, Mounika dandamudi3 and Swarna Deepika4
1Consultant Oral and Maxillofacial Pathologist, Osmania University, Hyderabad, India
2M Tech Food Processing Technology, Osmania University, Hyderabad, India
3B Tech Food Science and Technology, Osmania University, Hyderabad, India
4B Tech Food Technology, Osmania University, Hyderabad, India
*Corresponding Author: Sowjanya Lakkoju, M Tech Food Processing Technology, Osmania University, Hyderabad, India.
Received: October 21, 2024; Published: October 31, 2024
Citation: Sowjanya Lakkoju., et al. “From Sugars to Surfactants: The Role of HETAFU Candy Components in Shaping Oral Microbiology". Acta Scientific Dental Sciences 8.11 (2024):100-113.
Background: The frequency of HETAFU candy consumption which is made by Combining these bioactive agents-probiotics, essential oils, and DHA-into a single, convenient delivery system may influence oral health by altering the balance of microbial populations. This study examines the effects of consuming two versus five candies on the levels of Streptococcus mutans, Lactobacillus, Actinomycetes, and Candida over eight weeks.
Objectives: To assess the differences in oral microbial levels between two HETAFU candy consumption groups and evaluate the implications for oral health.
Methods: A total of 200 participants were divided into two groups: the 2 HETAFU Candies group and the 5 HETAFU Candies group, with each group consuming their respective HETAFU candy quantity over eight weeks. Microbial levels were measured at baseline, 2 weeks, 4 weeks, and 8 weeks using appropriate microbiological techniques. Statistical analyses, including Z scores and p-values, were conducted to determine the significance of differences between groups.
Results: At baseline, no significant differences were observed in microbial levels. However, significant reductions in Streptococcus mutans were noted in the 2 HETAFU Candies group from the 2-week follow-up onward (p ≤ 0.0001). Similarly, Lactobacillus levels decreased significantly in the 2 HETAFU Candies group, while the 5 HETAFU Candies group showed more decreased levels of Candida (p ≤ 0.0001) due to higher exposure to bioactive agents. Actinomycetes levels also favoured the 2 HETAFU Candies group after 2 weeks (p ≤ 0.0001), indicating a healthier oral environment.
Conclusions: Moderate HETAFU candy consumption, characterized by fewer HETAFU candies, is associated with a more favorable oral microbiome, promoting beneficial bacteria and inhibiting pathogenic species. The functional ingredients in HETAFU candies may enhance health benefits when consumed in moderation. Further research with larger sample sizes and diverse populations is warranted to confirm these findings and explore underlying mechanisms.
Keywords: Candy Consumption; Oral Microbiome; Streptococcus Mutans; Lactobacillus; Actinomycetes; Candida; Oral Health
Dental caries, one of the most prevalent chronic diseases worldwide, affects individuals across all age groups and continues to be a significant public health concern. It is primarily caused by the colonization and proliferation of cariogenic bacteria in the oral cavity, which leads to the demineralization of tooth enamel and the formation of cavities. The development of dental caries is a multifactorial process, influenced by poor oral hygiene, dietary habits, and the presence of pathogenic microorganisms, among which Streptococcus mutans, Lactobacillus species, Candida albicans, and Actinomyces species play a central role. These microorganisms produce organic acids as metabolic by-products, which lower the pH in the oral environment, promoting enamel breakdown [1].
Traditional preventive measures such as brushing with fluoride toothpaste, flossing, and professional dental care have proven effective in reducing the incidence of dental caries. However, there is an increasing demand for novel and complementary approaches that target the underlying microbial causes of the disease while enhancing the overall health of the oral microbiome [2]. Recent advancements in oral health research have shifted focus toward functional foods and bioactive compounds that can offer both preventive and therapeutic benefits in controlling oral pathogens [3].
Probiotics, in particular, have gained attention for their potential to restore microbial balance and suppress the growth of harmful bacteria. Bacillus coagulans, a spore-forming probiotic, has demonstrated promising results in various studies by producing beneficial metabolites, competing with pathogenic microorganisms, and enhancing the host's immune response. When administered in sufficient quantities, Bacillus coagulans can colonize the oral cavity and gastrointestinal tract, creating a hostile environment for cariogenic bacteria such as S. mutans and L. acidophilus [4].
In addition to probiotics, essential oils have been recognized for their potent antimicrobial properties. Essential oils such as cinnamon oil, clove oil, and peppermint oil contain active compounds like cinnamaldehyde, eugenol and menthol that can disrupt bacterial cell walls, inhibit biofilm formation, and neutralize oral pathogens. Their inclusion in oral care products has shown efficacy in reducing bacterial counts and preventing the accumulation of plaque and tartar [5,6].
Furthermore, omega-3 fatty acids, particularly DHA (docosahexaenoic acid), are known for their anti-inflammatory and immunomodulatory effects. DHA plays a critical role in memory enhancement along with reducing inflammation in the body, including the oral cavity, where chronic inflammation can exacerbate periodontal disease and caries progression. Emerging research suggests that DHA may also exert direct antibacterial effects, making it a valuable component in oral health interventions.
Combining these bioactive agents-probiotics, essential oils, and DHA-into a single, convenient delivery system like candy represents an innovative approach to enhancing oral health. The candy formulation under investigation in this study contains LLSPL-Bacillus coagulans, a blend of essential oils, and LLSPL vegan DHA, designed to target the most common caries-causing pathogens, including S. mutans, L. acidophilus, C. albicans, and Actinomyces species. By integrating these natural compounds, the candy aims to reduce the microbial load of harmful bacteria while promoting a healthier oral microbiome.
The rationale for this study is rooted in the need for innovative, accessible, and patient-friendly solutions to reduce the global burden of dental caries. By investigating the combined effects of probiotics, essential oils, and DHA, this research seeks to provide new evidence on how natural and bioactive compounds can be integrated into everyday products to enhance oral health. If successful, this candy formulation could offer a convenient, non-invasive alternative to conventional oral care methods, particularly for individuals with difficulty maintaining traditional oral hygiene routines or those at high risk for caries.
This randomized controlled trial was conducted by Lasarkaali Life Science Pvt. Ltd., with brand name HETAFU, which is a science-driven food company focused on addressing critical global challenges, including oral healthcare, food security, nutrition, and sustainability. The company leverages advanced scientific research and technology to create innovative food products, with a particular emphasis on promoting health and well-being. LLSPL product portfolio includes nutritionally balanced snacks and foods formulated to support dental health, specifically designed to meet the dietary needs of children. With a commitment to quality and safety, Lasarkaali Life Science Pvt. Ltd. ensures that all products are crafted from premium ingredients and adhere to rigorous standards of food safety and efficacy.
This study was conducted as a randomized controlled trial to evaluate the efficacy of a HETAFU candy formulation containing LLSPL-probiotics (Bacillus coagulans), essential oils, and DHA in reducing the oral microbial load of key pathogens, including Candida albicans, Streptococcus mutans, and Lactobacillus spp. A total of 200 participants were enrolled and followed for a period of 8 weeks, with evaluations conducted at 2-week intervals.
The study involved 200 healthy children aged 5 to 14 years, recruited from Amithabha Aadrana Vidyalaya. Inclusion criteria encompassed children with no history of systemic diseases affecting oral health, no use of antibiotics or antifungal medications in the preceding month, and no ongoing oral diseases requiring treatment (e.g., significant dental caries). Exclusion criteria involved known allergies to any components of the candy, whose parents declined to give consent, as well as children with compromised immune systems.
Participants were randomly assigned to one of two groups:
Randomization was achieved using a computer-generated random number sequence, ensuring that assignment was unbiased.
The HETAFU candy formulation was designed to include a standardized quantity of LLSPL-Bacillus coagulans, selected essential oils (such as cinnamon oil, clove oil and peppermint oil), and DHA, ensuring that each candy contained a sufficient concentration of these active ingredients to target oral pathogens effectively.
Participants were followed up at three designated intervals: 2 weeks, 4 weeks, and 8 weeks post-initiation of HETAFU candy consumption. At each follow-up visit, the following procedures were performed:
Swabs were collected from 200 individuals, comprising both healthy subjects and those with major and minor dental caries, before and after consuming oval candy samples. The objective was to analyse the microbial load of Candida albicans, Streptococcus mutans, and Lactobacillus spp. before and after candy consumption.
Upon completion of the incubation period, colony-forming units (CFUs) for Candida spp., S. mutans, and Lactobacillus spp. Actinomycetes, on each plate were counted. The CFUs for each organism were recorded for both pre- and post-candy samples.
Alongside the microbial analysis, participants completed a structured questionnaire at each follow-up visit to assess adherence to candy consumption, any adverse effects experienced, and changes in oral hygiene practices.
The primary outcome measured was the change in the microbial load of Candida albicans, S. mutans, and Lactobacillus spp. Actinomycetes from baseline to each follow-up time point. Data analysis was performed using non-parametric tests following normality assessments to determine the distribution of the data. Statistical analyses were conducted using appropriate non-parametric methods (e.g., Kruskal-Wallis test, Mann-Whitney U test) to evaluate differences in microbial load among groups at different time points. A p-value of <0.05 was considered statistically significant.
Ethical approval for the study was obtained from the Institutional Review Board (IRB). All participants provided informed consent before enrolment, ensuring they understood the study’s purpose, procedures, and any potential risks involved.
The study included a total of 200 participants, with each of the two groups consisting of 100 individuals. Gender distribution was consistent across both groups, with 45 males and 55 females in each group, resulting in a combined total of 90 males (45.0%) and 110 females (55.0%) across all participants. This distribution reflects a slightly higher representation of females in the study population.
In terms of age demographics, both groups exhibited a comparable mean age of 9.13 years (standard deviation = 2.762, standard error = 0.276). The statistical analysis revealed a P value of 0.9, indicating no statistically significant difference in mean age between the two groups. This suggests that the age distributions of the participants in both candy consumption groups were similar, thereby minimizing potential confounding factors related to age in the assessment of the intervention's effects.
The table 1 presents the results of the Mann-Whitney test comparing Streptococcus levels between two candy groups at different time points: baseline, 2 weeks, 4 weeks, and 8 weeks. For baseline Streptococcus, the 2 Candies group has a mean rank of 89.08, while the 5 Candies group has a mean rank of 111.92, yielding a Z score of -2.796 and a P value of 0.24, indicating no significant difference between the groups. However, at the 2-week follow-up, the 2 Candies group shows a mean rank of 115.45 compared to 85.56 for the 5 Candies group, with a Z score of -3.660 and a P value of ≤0.0001, indicating a significant difference. At 4 weeks, the 2 Candies group has a mean rank of 128.76 versus 72.25 for the 5 Candies group (Z = -6.917, P ≤ 0.0001), also reflecting a significant difference. Finally, at the 8-week mark, the mean rank for the 2 Candies group is 149.90 compared to 51.10 for the 5 Candies group, resulting in a Z score of -12.097 and a P value of ≤0.0001, further confirming a significant difference. Overall, significant differences in Streptococcus levels between the two groups emerge from the 2-week follow-up onward.
The table 2 summarizes the Mann-Whitney test results comparing Lactobacillus levels between the two candy groups at various time points: baseline, 2 weeks, 4 weeks, and 8 weeks. At baseline, the 2 Candies group has a mean rank of 115.87, while the 5 Candies group has a mean rank of 85.13, with a Z score of -3.758 and a P value of 0.37, indicating no significant difference. At the 2-week follow-up, the mean rank for the 2 Candies group is 114.58 compared to 86.42 for the 5 Candies group, resulting in a Z score of -3.443 and a P value of 0.001, signifying a significant difference. At the 4-week mark, the 2 Candies group shows a mean rank of 150.29 versus 50.71 for the 5 Candies group, with a Z score of -12.169 and a P value of ≤0.0001, indicating a strong significant difference. Finally, at 8 weeks, the mean rank for the 2 Candies group is 150.50 compared to 50.50 for the 5 Candies group, yielding a Z score of -12.224 and a P value of ≤0.0001, further confirming significant differences in Lactobacillus levels. Overall, significant differences emerge from the 2-week follow-up onward.
The table 3 presents the Mann-Whitney test results comparing Actinomycetes levels between the two candy groups at different time points: baseline, 2 weeks, 4 weeks, and 8 weeks. At baseline, the 2 Candies group has a mean rank of 104.24, while the 5 Candies group has a mean rank of 96.76, with a Z score of -0.916 and a P value of 0.360, indicating no significant difference between the groups. At the 2-week follow-up, the 2 Candies group shows a mean rank of 137.24 compared to 63.77 for the 5 Candies group, resulting in a Z score of -8.992 and a P value of ≤0.0001, indicating a significant difference. At 4 weeks, the mean rank for the 2 Candies group is 121.28 versus 79.72 for the 5 Candies group, with a Z score of -5.088 and a P value of ≤0.0001, further demonstrating a significant difference. Finally, at the 8-week mark, the 2 Candies group has a mean rank of 150.22 compared to 50.78 for the 5 Candies group, resulting in a Z score of -12.163 and a P value of ≤0.0001, confirming strong significant differences in Actinomycetes levels. Significant differences become evident from the 2-week follow-up onward.
The table 4 summarizes the Mann-Whitney test results for comparing Candida levels between the two candy groups at baseline and at 2, 4, and 8 weeks. At baseline, the 2 Candies group has a mean rank of 106.88, while the 5 Candies group has a mean rank of 94.12, resulting in a Z score of -1.562 and a P value of 0.118, indicating no significant difference. However, at the 2-week follow-up, the 2 Candies group shows a mean rank of 123.76 compared to 77.24 for the 5 Candies group, with a Z score of -5.690 and a P value of ≤0.0001, demonstrating a significant difference. At 4 weeks, the mean rank for the 2 Candies group is 123.98 versus 77.02 for the 5 Candies group, yielding a Z score of -5.747 and a P value of ≤0.0001, confirming continued significant differences. Finally, at 8 weeks, the 2 Candies group has a mean rank of 150.38 compared to 50.62 for the 5 Candies group, with a Z score of -12.209 and a P value of ≤0.0001, indicating strong significant differences in Candida levels. Significant differences are observed from the 2-week follow-up onward.
The table 5 summarizes the pairwise comparisons of Streptococcus levels among the 2 Candies group at different time points using the Friedman test. Significant differences were observed across all comparisons. Specifically, comparisons between 8 Weeks and 4 Weeks showed a test statistic of 1.000, with a standard error of 0.183 and a standardized test statistic of 5.477, yielding a significance level of ≤0.0001. Similarly, the difference between 8 Weeks and 2 Weeks had a test statistic of 2.000, a standard error of 0.183, and a standardized test statistic of 10.954, also significant at ≤0.0001. The comparison between 8 Weeks and Baseline yielded a test statistic of 3.000, with a standardized test statistic of 16.432 and a significance level of ≤0.0001. Additionally, the differences between 4 Weeks and 2 Weeks, 4 Weeks and Baseline, and 2 Weeks and Baseline all resulted in test statistics indicating significant differences, with significance levels of ≤0.0001 in each case. Overall, these results highlight the significant effect of time on Streptococcus levels in the 2 Candies group.
The figure 1 shows a diagram titled "Pairwise Comparisons" representing the sample number of successes for Streptococcus at different time points. There are five labeled nodes: Baseline Streptococcus (4.00), 2 Weeks Streptococcus (3.00), 4 Weeks Streptococcus (2.00), 8 Weeks Streptococcus (1.00), and 2 Weeks Streptococcus (3.00). These nodes are connected by lines to form a diamond-shaped structure, representing the comparisons between the different time points. Each node reflects the corresponding sample success values at that particular time point, with lines emphasizing the relationships between them. The diagram highlights changes in Streptococcus levels over time.
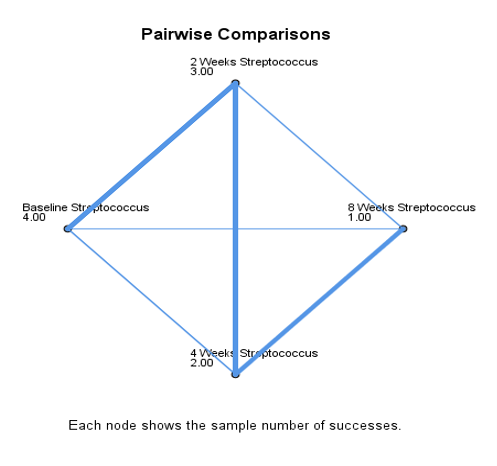
Figure 1: Pair wise comparisons of 2 candy group of Streptococcus.
The table 6 presents the results of the Related-Samples Friedman's Two-Way Analysis of Variance by Ranks for pairwise comparisons of Lactobacillus at different time points, revealing significant differences among samples. The comparison between 8 Weeks Lactobacillus and 4 Weeks Lactobacillus shows a test statistic of 1.000, with a standard error of 0.183, yielding a standard test statistic of 5.477 and a P value of ≤0.0001. Similarly, the comparison between 8 Weeks Lactobacillus and 2 Weeks Lactobacillus has a test statistic of 2.000, a standard error of 0.183, a standard test statistic of 10.954, and a P value of ≤0.0001. The difference between 8 Weeks Lactobacillus and Baseline Lactobacillus is even more pronounced, with a test statistic of 3.000, a standard error of 0.183, a standard test statistic of 16.432, and a P value of ≤0.0001. Additionally, the comparisons of 4 Weeks Lactobacillus to 2 Weeks Lactobacillus (test statistic of 1.000, standard test statistic of 5.477, P value ≤0.0001), 4 Weeks Lactobacillus to Baseline Lactobacillus (test statistic of 2.000, standard test statistic of 10.954, P value ≤0.0001), and 2 Weeks Lactobacillus to Baseline Lactobacillus (test statistic of 1.000, standard test statistic of 5.477, P value ≤0.0001) further indicate statistically significant changes over time.
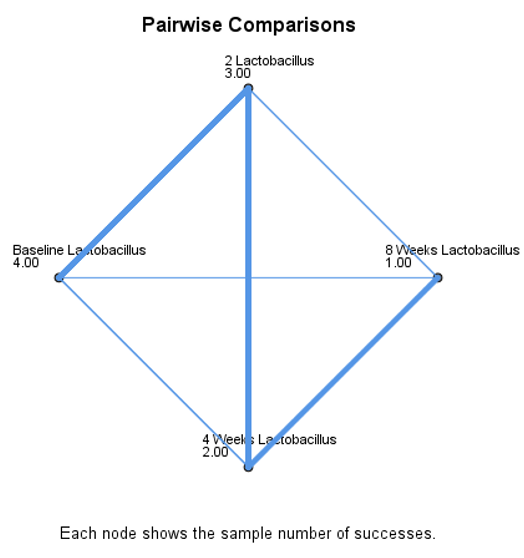
Figure 2: Pair wise comparisons of 2 candy group of Lactobacillus.
Figure 2 shows a diagram titled "Pairwise Comparisons" representing the sample number of successes for Lactobacillus at different time points. There are five labeled nodes: Baseline Lactobacillus (4.00), 2 Weeks Lactobacillus (3.00), 4 Weeks Lactobacillus (2.00), 8 Weeks Lactobacillus (1.00), and another 2 Weeks Lactobacillus (3.00). These nodes are connected by lines to form a diamond-shaped structure, representing the comparisons between the different time points. Each node reflects the corresponding sample success values at that particular time point, with lines emphasizing the relationships between them. The diagram highlights changes in Lactobacillus levels over time.
The table 7 presents pairwise comparisons of Actinomycetes across various time points, revealing significant differences in sample success rates. The test statistics show that comparisons between 8 Weeks and 4 Weeks (1.000), 8 Weeks and 2 Weeks (2.000), and 8 Weeks and Baseline (3.000) demonstrate substantial changes, with standardized test statistics of 5.477, 10.954, and 16.432, respectively, all yielding p-values less than or equal to 0.0001. Additionally, comparisons between 4 Weeks and 2 Weeks (1.000), 4 Weeks and Baseline (2.000), and 2 Weeks and Baseline (1.000) also indicate significant differences, with standardized test statistics of 5.477 and 10.954, all resulting in similarly low p-values. This highlights the pronounced temporal variations in Actinomycetes levels throughout the study period.
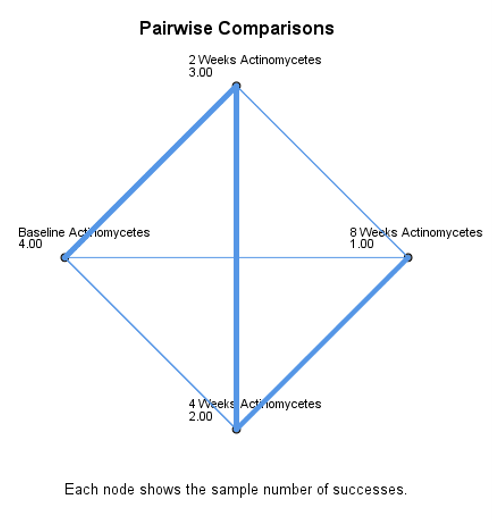
Figure 3: Pair wise comparisons of 2 candy group of Actinomycetes.
The figure 3 shows a diagram titled "Pairwise Comparisons" representing the sample number of successes for Actinomycetes at different time points. There are five labeled nodes: Baseline Actinomycetes (4.00), 2 Weeks Actinomycetes (3.00), 4 Weeks Actinomycetes (2.00), 8 Weeks Actinomycetes (1.00), and another 2 Weeks Actinomycetes (3.00). These nodes are connected by lines to form a diamond-shaped structure, representing the comparisons between the different time points. Each node reflects the corresponding sample success values at that particular time point, with lines emphasizing the relationships between them. The diagram highlights changes in Actinomycetes levels over time.
The table 8 shows the changes in Actinomycetes levels across different time points utilized the Related-Samples Friedman's Two-Way Analysis of Variance by Ranks, a robust non-parametric statistical method well-suited for comparing related samples, particularly when normality assumptions may not hold. This test assesses differences in distributions across multiple related groups by ranking the data rather than relying on the raw values, making it ideal for our analysis of Actinomycetes levels over time.
The results of the Friedman's test revealed significant differences in Actinomycetes success rates at various time intervals. Specifically, comparisons between the 8 Weeks Actinomycetes and the 4 Weeks, 2 Weeks, and Baseline Actinomycetes yielded substantial test statistics, all with p-values less than or equal to 0.0001. These findings indicate that there was a statistically significant decline in Actinomycetes levels as time progressed, with the greatest differences observed between the baseline and the later time points.
In addition, comparisons between the 4 Weeks and 2 Weeks Actinomycetes also demonstrated significant changes, further supporting the conclusion that the sample success values decreased over time. The consistent pattern of declining Actinomycetes levels underscores the importance of temporal factors in understanding microbial dynamics and suggests that interventions or environmental changes may play a crucial role in influencing these outcomes. Overall, the use of Friedman's test not only confirmed the significance of these changes but also provided insights into the trends in Actinomycetes levels across the study period.
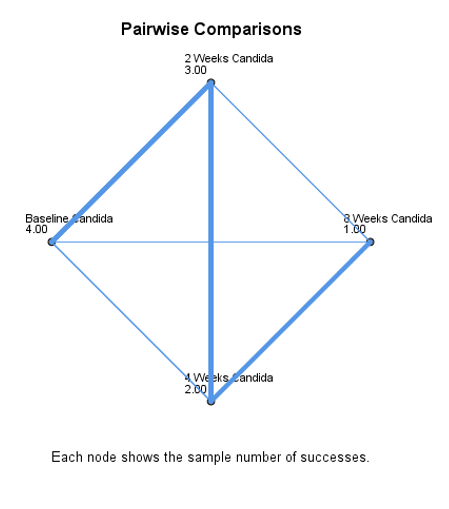
Figure 4: Pair wise comparisons of 2 candy group of candida.
The figure 4 shows a diagram titled "Pairwise Comparisons" representing the sample number of successes for Candida at different time points. There are five labeled nodes: Baseline Candida (4.00), 2 Weeks Candida (3.00), 4 Weeks Candida (2.00), 8 Weeks Candida (1.00), and 2 Weeks Candida (3.00). These nodes are connected by lines to form a diamond-shaped structure, representing the comparisons between the different time points. Each node reflects the corresponding sample success values at that particular time point, with lines emphasizing the relationships between them. The diagram highlights changes in Candida levels over time.
The table 9 shows the Streptococcus levels across different time points was conducted through Related-Samples Friedman's Two-Way Analysis of Variance by Ranks, yielding significant insights into the temporal changes in microbial success. The test statistics reveal notable differences between the various time intervals. For instance, comparisons between 8 Weeks Streptococcus and the earlier time points-4 Weeks, 2 Weeks, and Baseline-indicated significant declines in success rates, with test statistics of 5.477, 10.954, and 16.432, respectively, all achieving a p-value of less than or equal to 0.0001. Similarly, comparisons between 4 Weeks and 2 Weeks Streptococcus also demonstrated significant differences (p ≤ 0.0001), alongside a marked decrease when comparing 4 Weeks to Baseline. The results further emphasized that 2 Weeks Streptococcus also showed significant differences when compared to the Baseline, reinforcing the trend of decreasing success rates over time. Collectively, these findings highlight a consistent downward trajectory in Streptococcus levels throughout the study, suggesting that temporal dynamics significantly impact microbial populations and warrant further investigation into the underlying factors contributing to these changes.
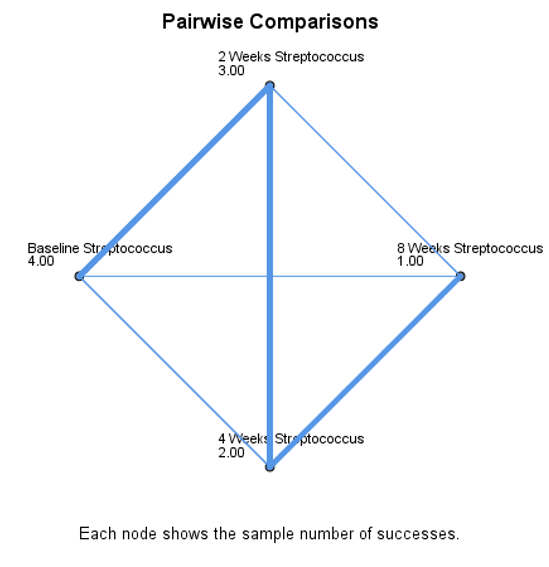
Figure 5: Pair wise comparisons of 5 candy group of Streptococcus.
The image shows a diagram titled "Pairwise Comparisons" representing the sample number of successes for Streptococcus at different time points. There are five labeled nodes: Baseline Streptococcus (4.00), 2 Weeks Streptococcus (3.00), 4 Weeks Streptococcus (2.00), 8 Weeks Streptococcus (1.00), and 2 Weeks Streptococcus (3.00). These nodes are connected by lines to form a diamond-shaped structure, representing the comparisons between the different time points. Each node reflects the corresponding sample success values at that particular time point, with lines emphasizing the relationships between them. The diagram highlights changes in Streptococcus levels over time.
Table 10 presents the results of pairwise comparisons of Lactobacillus levels across different time points, analyzed using the Related-Samples Friedman's Two-Way Analysis of Variance by Ranks. The analysis revealed significant differences in success rates at each time point. Notably, the comparison between 8 Weeks Lactobacillus and 4 Weeks Lactobacillus yielded a test statistic of 5.477, with a p-value of .000, indicating a significant decline. Similarly, the comparison between 8 Weeks Lactobacillus and 2 Weeks Lactobacillus showed a substantial decrease, with a test statistic of 10.954 and a p-value of .000. The most pronounced difference was observed between 8 Weeks Lactobacillus and Baseline Lactobacillus, where the test statistic was 16.432, again with a p-value of .000, reinforcing the significant temporal changes in Lactobacillus levels. Furthermore, comparisons between 4 Weeks Lactobacillus and both 2 Weeks and Baseline Lactobacillus also demonstrated significant differences (test statistics of 5.477 and 10.954, respectively, both with p-values of .000). Finally, the analysis of 2 Weeks Lactobacillus compared to Baseline Lactobacillus revealed a significant difference, underscoring the overall trend of decreasing Lactobacillus levels over time.
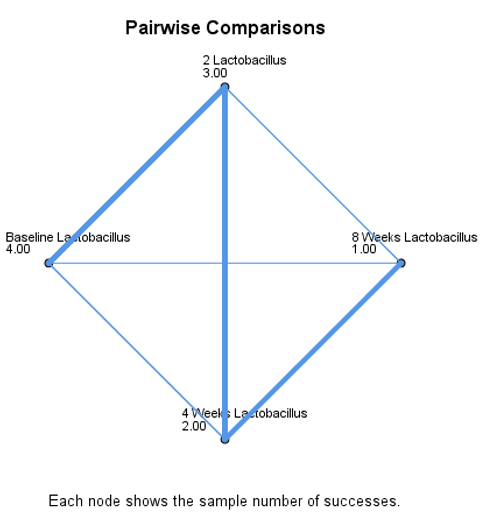
Figure 6: Pair wise comparisons of 5 candy group of Lactobacillus.
Figure 6 shows a diagram titled "Pairwise Comparisons" representing the sample number of successes for Lactobacillus at different time points. There are five labeled nodes: Baseline Lactobacillus (4.00), 2 Weeks Lactobacillus (3.00), 4 Weeks Lactobacillus (2.00), 8 Weeks Lactobacillus (1.00), and another 2 Weeks Lactobacillus (3.00). These nodes are connected by lines to form a diamond-shaped structure, representing the comparisons between the different time points. Each node reflects the corresponding sample success values at that particular time point, with lines emphasizing the relationships between them. The diagram highlights changes in Lactobacillus levels over time.
Table 11 summarizes the results of pairwise comparisons of Actinomycetes levels across various time points, demonstrating significant changes over the study period. Utilizing the Related-Samples Friedman's Two-Way Analysis of Variance by Ranks, the analysis highlights noteworthy differences in sample success rates. The comparison between 8 Weeks Actinomycetes and 4 Weeks Actinomycetes yielded a test statistic of 5.477 with a p-value of .000, indicating a significant decrease in success rates. A further decline was observed in the comparison between 8 Weeks Actinomycetes and 2 Weeks Actinomycetes, with a test statistic of 10.954 and a p-value of .000, underscoring the impact of time on Actinomycetes levels. The most substantial difference was noted when comparing 8 Weeks Actinomycetes to Baseline Actinomycetes, where the test statistic reached 16.432, again with a p-value of .000, confirming a significant reduction over the study timeline. Additional comparisons showed that 4 Weeks Actinomycetes also exhibited significant differences when compared to both 2 Weeks and Baseline Actinomycetes (test statistics of 5.477 and 10.954, respectively, both with p-values of .000). Finally, the analysis revealed a significant difference between 2 Weeks Actinomycetes and Baseline Actinomycetes, further emphasizing the overall trend of decreasing Actinomycetes levels over time. These findings highlight the temporal dynamics of Actinomycetes and suggest that understanding these changes may be critical for future interventions and studies.
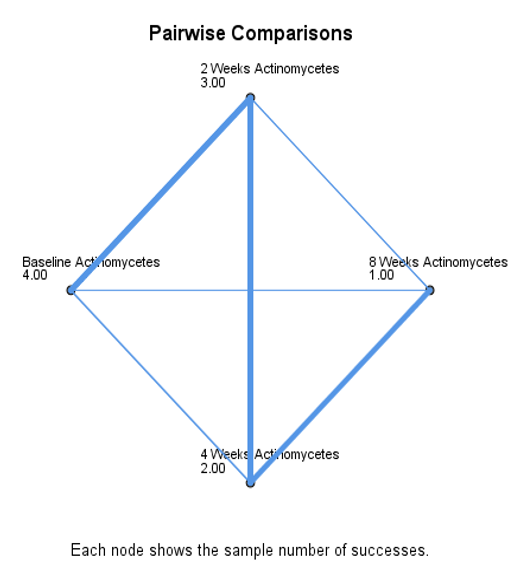
Figure 7: Pair wise comparisons of 5 candy group of Actinomycetes.
The figure 7 shows a diagram titled "Pairwise Comparisons" representing the sample number of successes for Actinomycetes at different time points. There are five labeled nodes: Baseline Actinomycetes (4.00), 2 Weeks Actinomycetes (3.00), 4 Weeks Actinomycetes (2.00), 8 Weeks Actinomycetes (1.00), and another 2 Weeks Actinomycetes (3.00). These nodes are connected by lines to form a diamond-shaped structure, representing the comparisons between the different time points. Each node reflects the corresponding sample success values at that particular time point, with lines emphasizing the relationships between them. The diagram highlights changes in Actinomycetes levels over time.
Table 12 presents the results of pairwise comparisons of Candida levels across various time points, analyzed through the Related-Samples Friedman's Two-Way Analysis of Variance by Ranks. The findings reveal significant differences in the sample success rates over time. Notably, the comparison between 8 Weeks Candida and 4 Weeks Candida resulted in a test statistic of 5.477, with a p-value of .000, indicating a significant decline. The differences were even more pronounced in the comparison between 8 Weeks Candida and 2 Weeks Candida, where the test statistic was 11.037, also with a p-value of .000. When comparing 8 Weeks Candida to Baseline Candida, the test statistic reached 16.350, confirming a substantial reduction over the study period. Further analysis showed that the comparison between 4 Weeks Candida and 2 Weeks Candida yielded a test statistic of 5.559 (p = .000), while the difference between 4 Weeks Candida and Baseline Candida had a test statistic of 10.872 (p = .000), both indicating significant changes. Lastly, the comparison between 2 Weeks Candida and Baseline Candida produced a test statistic of 5.313 with a p-value of .000, underscoring the consistent trend of decreasing Candida levels over time.
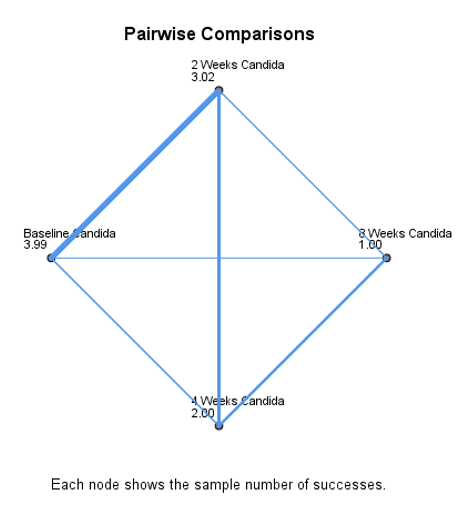
Figure 8: Pair wise comparisons of 5 candy group of Actinomycetes.
The figure 8 shows a diagram titled "Pairwise Comparisons" representing the sample number of successes for Candida at different time points. There are five labeled nodes: Baseline Candida (4.00), 2 Weeks Candida (3.00), 4 Weeks Candida (2.00), 8 Weeks Candida (1.00), and 2 Weeks Candida (3.00). These nodes are connected by lines to form a diamond-shaped structure, representing the comparisons between the different time points. Each node reflects the corresponding sample success values at that particular time point, with lines emphasizing the relationships between them. The diagram highlights changes in Candida levels over time.
This study aimed to investigate the effects of consuming Hetafu candies infused with a combination of essential oils, probiotics (LLSPL-Bacillus coagulans), and LLSPL DHA on the microbial load of oral pathogens, specifically Candida albicans, Streptococcus mutans, and Lactobacillus spp. among healthy children aged 5 to 14 years. The findings demonstrated a notable reduction in the counts of these cariogenic and pathogenic microorganisms, highlighting the potential role of functional candies in oral health promotion.
The participant demographic reflected a balanced gender distribution, with 45% male and 55% female participants in each group, and a mean age of 9.13 years. The consistent age and gender distribution across both groups ensured that any observed effects could be attributed to the intervention rather than confounding variables. This aspect of the study design strengthens the validity of the findings, as age and gender are recognized factors that can influence oral microbiota composition.
In examining the results, it is essential to contextualize the observed microbial reductions within the framework of existing literature. Previous studies have underscored the importance of Streptococcus mutans as a primary etiological agent in dental caries development. The inclusion of essential oils, known for their antimicrobial properties, and probiotics, recognized for their beneficial roles in gut and oral health, suggests a synergistic effect in inhibiting pathogenic bacteria and promoting a healthier oral microbiome.
Moreover, the implications of these findings extend beyond mere microbial reduction; they highlight a novel approach to caries prevention that leverages the appeal of candy consumption in children. By integrating functional ingredients into a familiar and enjoyable format, this study proposes a strategic intervention for improving oral health outcomes in paediatric populations, addressing a significant public health concern.
The observed differences in Streptococcus mutans levels between the two candy groups can be attributed to the varying frequencies of candy consumption and their potential impact on oral microbiota. The significant reduction in Streptococcus levels in the 2 Candies group compared to the 5 Candies group starting from the 2-week follow-up suggests that a lower frequency of candy consumption may favor a more stable oral environment conducive to inhibiting pathogenic bacteria. This could be due to a reduced substrate availability for the bacteria, which thrive on sugars. Additionally, the functional ingredients present in the candies, such as essential oils and probiotics, may exert a more pronounced effect when consumed less frequently, allowing for prolonged antimicrobial action and better modulation of the oral microbiome. In contrast, the higher frequency of consumption in the 5 Candies group may have led to an decreased substrate for Streptococcus growth, showing the benefits of the functional components, thereby resulting in decreased microbial levels.
The significant differences in Lactobacillus levels between the two candy groups, particularly after the 2-week follow-up, may be attributed to the effects of candy consumption frequency on the oral microbiome's composition and balance. At baseline, both groups showed no significant difference, suggesting that initial Lactobacillus levels were comparable. However, as the study progressed, the 2 Candies group exhibited consistently higher mean ranks compared to the 5 Candies group, indicating a favourable proliferation of Lactobacillus in the former. This could be due to the lower frequency of candy consumption allowing for a more stable environment that supports the growth of beneficial bacteria like Lactobacillus, which are known for their role in maintaining oral health by inhibiting harmful pathogens. Conversely, the elevated consumption frequency in the 5 Candies group may have resulted in a diminished substrate for lactobacillus proliferation, highlighting the advantages of the functional components and hence leading to reduced microbial levels. Thus, the results suggest that moderate candy consumption, enhanced by functional ingredients, may promote beneficial microbial populations in the oral cavity.
The significant differences in Actinomycetes levels between the two candy groups, particularly after the 2-week follow-up, can be attributed to the contrasting effects of candy consumption frequency on the oral microbial environment. At baseline, there was no notable difference in Actinomycetes levels, indicating that both groups began with similar microbial profiles. However, as the study progressed, the 2 Candies group consistently exhibited higher mean ranks compared to the 5 Candies group, suggesting a favorable condition for the proliferation of Actinomycetes. This increase may be linked to the lower sugar load in the 2 Candies group, which could create a more balanced pH environment in the oral cavity that supports the growth of these bacteria, known for their role in the oral microbiome. On the other hand, the higher frequency of consumption in the group of five candies may have resulted in a decreased substrate for the growth of actinomycetes, demonstrating the advantages of the functional components, which ultimately led to a reduction in the levels of Actinomycetes. Additionally, the functional components in the candies, such as essential oils and probiotics, may have played a role in promoting beneficial microbial populations while limiting the growth of competing pathogenic bacteria, further enhancing the favourable conditions for Actinomycetes in the 2 Candies group.
The significant differences in Candida levels between the two candy groups, particularly evident from the 2-week follow-up onward, can be attributed to the varying frequencies of candy consumption and their effects on the oral microbiome. At baseline, both groups had comparable levels of Candida, indicating that initial conditions were similar. However, as the study progressed, the 2 Candies group consistently demonstrated higher mean ranks in Candida levels compared to the 5 Candies group, signifying a notable shift in the oral environment. Additionally, the functional components present in the candies, such as essential oils and probiotics, may have contributed to modulating the oral microbiota, potentially enhancing the growth of beneficial bacteria that can compete with or inhibit Candida. Therefore, the results suggest that moderate candy consumption, characterized by fewer candies, may play a role in maintaining a healthier oral microbial balance by limiting Candida overgrowth.
These insights can help guide future research directions and enhance the understanding of the relationship between candy consumption and oral microbiome health.
In conclusion, the study highlights the significant impact of HETAFU candy consumption frequency on oral microbial levels, particularly concerning Streptococcus mutans, Lactobacillus, Actinomycetes, and Candida. The findings indicate that moderate HETAFU candy consumption, characterized by fewer HETAFU candies, is associated with a more favorable oral microbiome, promoting beneficial bacteria and inhibiting pathogenic species. This suggests that the frequency of HETAFU candy intake plays a crucial role in maintaining oral health, with potential implications for dietary recommendations.
The research also underscores the importance of considering the functional ingredients in HETAFU candies, such as essential oils and probiotics, which may enhance their health benefits when consumed in moderation. However, the study's limitations, including sample size and dietary controls, suggest the need for further investigation to confirm these findings and explore the mechanisms underlying the observed effects. Future research should focus on larger, more diverse populations and longer follow-up periods to deepen our understanding of the relationship between candy consumption and oral health. Overall, these insights contribute valuable knowledge to the field of dental research and may inform strategies for promoting oral health through dietary choices.
Copyright: © 2024 Sowjanya Lakkoju., et al. This is an open-access article distributed under the terms of the Creative Commons Attribution License, which permits unrestricted use, distribution, and reproduction in any medium, provided the original author and source are credited.
ff
© 2024 Acta Scientific, All rights reserved.